Scratch

Internal · Not published

Parked figures

Contents
  1. 1 Parked figures
  2. 2 Graphs (temp)

Parked figures

Scratch page. These figures were built for Class 1 and lifted out of it so the class would read cleanly. Nothing here is published; keep or discard as each one finds a home. Moved from module1.html (section “Graphs (temp)”) on 2026-08-03.

Graphs (temp)

[This is a temporary section to work on reproducing figures/graphs/charts, and will be removed as the graphs get placed in their respective sections.]

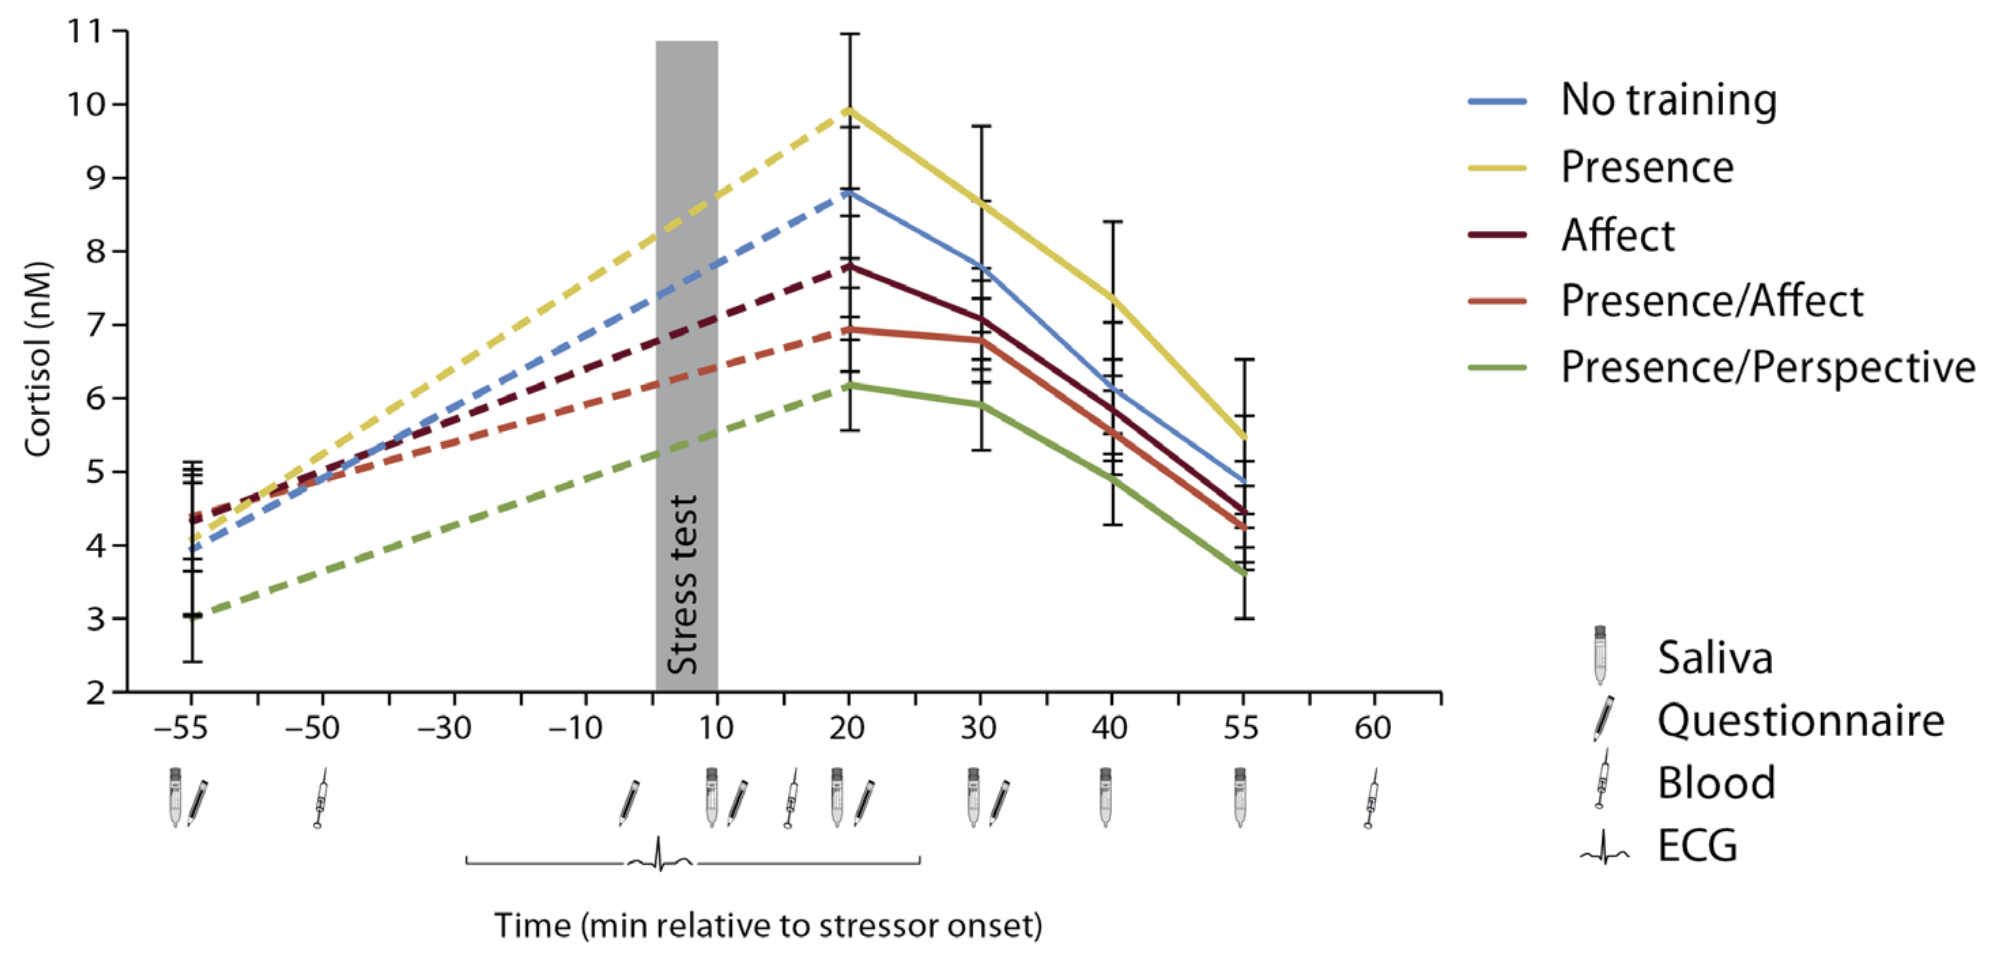
Cortisol reactivity ranged from highest after presence training to lowest after presence + perspective training

Line chart of raw salivary cortisol in nanomolar across the stress-testing session for five training groups: no training, presence, affect, presence/affect, and presence/perspective. All five groups rise sharply after the stress test around minute 0 and decline during recovery. Presence rises highest, to about 10 nM at 20 minutes; presence/perspective rises least, to about 6 nM.
[**This chart will be changed!** See Trello Card https://trello.com/c/gJ5WpPaU Maybe included in Class 6, we decided to leave out for Class 1.] Raw salivary cortisol (nanomolar) across the stress-testing session, separated by training group; error bars are SEM. Source: Engert et al., 2017, Fig. 1C.

Presence + affect training blunted the cortisol stress response

Three lines across three timepoints, minutes relative to stressor onset: minus 55, 20, and 55. Ln cortisol starts equal for all three groups at baseline. No training rises highest at 20 minutes, presence rises even higher, and presence plus affect training rises least. All three groups partially recover by 55 minutes, with presence plus affect ending lowest. 1.0 1.4 1.8 0.6 Ln (cortisol) −55 20 55 Time (min relative to stressor onset) No training, −55 min: 1.20 No training, 20 min: 1.90 No training, 55 min: 0.97 Presence, −55 min: 1.20 Presence, 20 min: 1.97 Presence, 55 min: 1.08 Presence/Affect, −55 min: 1.20 Presence/Affect, 20 min: 1.57 Presence/Affect, 55 min: 0.85 No training Presence Presence/Affect
Log cortisol at baseline, 20 minutes, and 55 minutes after the stress test, for the three training conditions shown. Source: Engert et al., 2017, Fig. 2B. Shows 3 of the study's 5 groups; values traced from the published figure.
View chart data
Ln cortisol by training condition.
Time (min relative to stressor onset)No trainingPresencePresence/Affect
−551.201.201.20
201.901.971.57
550.971.080.85

Presence + affect training preserved heart-rate variability under stress

Three lines across three phases of the stress response: baseline, stress, and recovery. Ln HF-HRV starts equal for all three groups at baseline, drops for all groups during the stress phase, and partially recovers afterward. No training and presence drop the most during stress; presence plus affect training drops the least and recovers to the highest value. 5.0 5.4 5.8 4.6 Ln (HF-HRV) Baseline Stress Recovery Phases of the stress response No training, Baseline: 5.85 No training, Stress: 5.09 No training, Recovery: 5.31 Presence, Baseline: 5.85 Presence, Stress: 4.94 Presence, Recovery: 5.49 Presence/Affect, Baseline: 5.85 Presence/Affect, Stress: 5.43 Presence/Affect, Recovery: 5.60 No training Presence Presence/Affect
Ln HF-HRV across baseline, stress, and recovery phases, for the three training conditions shown. Source: Engert et al., 2017, Fig. 2E. Shows 3 of the study's 5 groups; values traced from the published figure.
View chart data
Ln HF-HRV by training condition.
PhaseNo trainingPresencePresence/Affect
Baseline5.855.855.85
Stress5.094.945.43
Recovery5.315.495.60

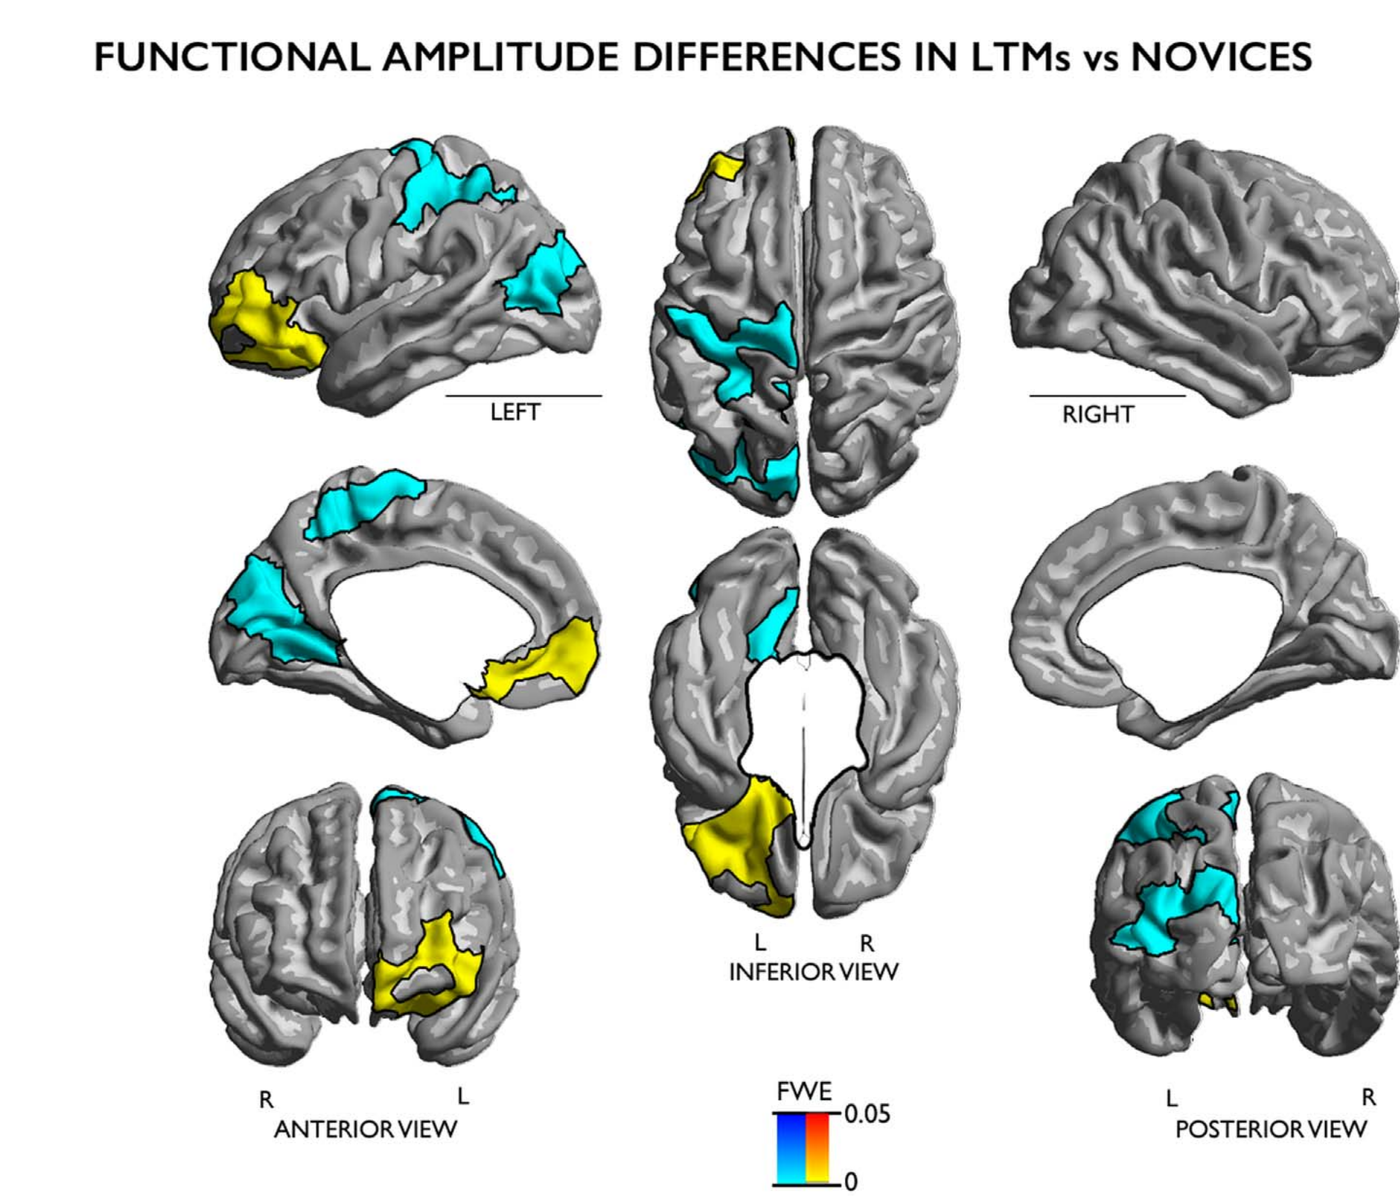
Long-term meditators showed amplitude differences from novices across prefrontal, cingulate, and parietal regions during lovingkindness meditation

Brain surface renderings from multiple views showing clusters of increased (yellow) and decreased (cyan) functional amplitude in long-term meditators versus novices during lovingkindness meditation, concentrated in left frontopolar, orbitofrontal, and parietal regions.
[**Placeholder screenshot. Will be replaced with a proper reproduction.**] Between-group interaction of functional amplitude differences during a 7-minute lovingkindness meditation session relative to a non-meditative resting-state session, in long-term meditators relative to novices. Source: Engen et al., 2018, Fig. 2.

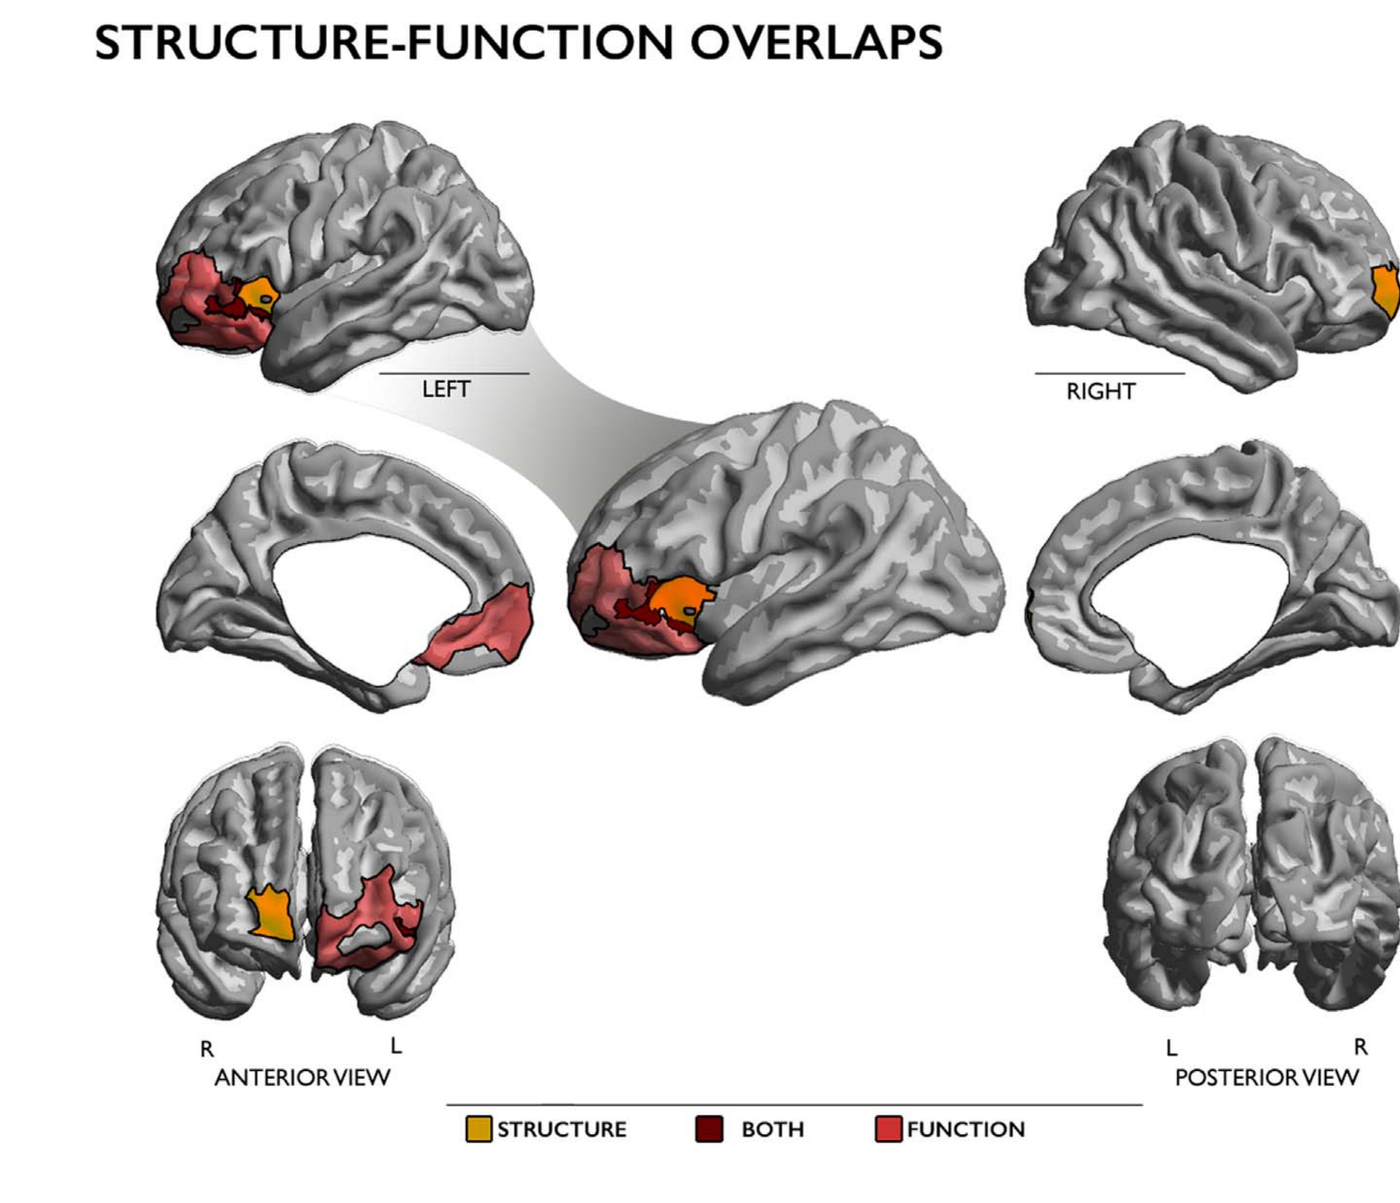
Structural and functional differences in long-term meditators overlapped in left ventrolateral prefrontal cortex

Brain surface renderings showing overlap between structural (orange) and functional (red) differences in long-term meditators versus novices, with overlap (dark red) concentrated in left ventrolateral prefrontal cortex.
[**Placeholder screenshot. Will be replaced with a proper reproduction.**] Overlap analysis between structural and functional findings. Source: Engen et al., 2018, Fig. 3.

Monitor+Accept training raised end-of-day positive affect more than monitoring alone or control

Grouped bar chart, three study conditions, baseline versus post-intervention end-of-day positive affect on a 1-to-7 scale. Monitor+Accept rises from 3.40 to 4.10. Monitor Only rises slightly from 3.31 to 3.67. Control rises only slightly from 3.55 to 3.70. 1 2 3 4 5 6 7 End-of-day positive affect Monitor+Accept Monitor Only Control Monitor+Accept, Baseline: 3.40 (SEM 0.13) Monitor+Accept, Post-Intervention: 4.10 (SEM 0.13) Monitor Only, Baseline: 3.31 (SEM 0.14) Monitor Only, Post-Intervention: 3.67 (SEM 0.12) Control, Baseline: 3.55 (SEM 0.16) Control, Post-Intervention: 3.70 (SEM 0.15) Baseline Post-Intervention
Study 2 diary-assessed positive affect (overall) at baseline and post-intervention, by study condition; error bars are SEM. Source: Lindsay et al., 2018, Fig. 2B. Values traced from the published figure.
View chart data
End-of-day positive affect (1–7 scale), mean ± SEM.
ConditionBaselinePost-intervention
Monitor+Accept3.40 ± 0.134.10 ± 0.13
Monitor Only3.31 ± 0.143.67 ± 0.12
Control3.55 ± 0.163.70 ± 0.15

Monitor+Accept training reduced diary-assessed loneliness; monitoring alone and control did not

Grouped bar chart, three study conditions, baseline versus post-intervention diary-assessed loneliness on a 1-to-4 scale. Monitor+Accept drops from 2.25 to 1.76. Monitor Only stays flat, 1.97 to 1.99. Control stays flat, 2.26 to 2.27. 1 1.5 2 2.5 3 3.5 4 Diary-assessed loneliness Monitor+Accept Monitor Only Control Monitor+Accept, Baseline: 2.25 (SEM 0.15) Monitor+Accept, Post-Intervention: 1.76 (SEM 0.15) Monitor Only, Baseline: 1.97 (SEM 0.15) Monitor Only, Post-Intervention: 1.99 (SEM 0.15) Control, Baseline: 2.26 (SEM 0.19) Control, Post-Intervention: 2.27 (SEM 0.19) Baseline Post-Intervention
Baseline and postintervention diary ratings of loneliness by condition; error bars depict SEM. Source: Lindsay et al., 2019, Fig. 1. Values from Table 1.
View chart data
Diary-assessed loneliness (1–4 scale), mean ± SEM.
ConditionBaselinePost-intervention
Monitor+Accept2.25 ± 0.151.76 ± 0.15
Monitor Only1.97 ± 0.151.99 ± 0.15
Control2.26 ± 0.192.27 ± 0.19

Monitor+Accept training increased daily social interactions; monitoring alone and control did not

Grouped bar chart, three study conditions, baseline versus post-intervention number of social interactions assessed via ecological momentary assessment, on a 1-to-4 scale. Monitor+Accept rises from 2.58 to 2.98. Monitor Only stays flat, 2.60 to 2.55. Control stays flat, 2.40 to 2.42. 1 1.5 2 2.5 3 3.5 4 Number of social interactions Monitor+Accept Monitor Only Control Monitor+Accept, Baseline: 2.58 (SEM 0.21) Monitor+Accept, Post-Intervention: 2.98 (SEM 0.21) Monitor Only, Baseline: 2.60 (SEM 0.21) Monitor Only, Post-Intervention: 2.55 (SEM 0.21) Control, Baseline: 2.40 (SEM 0.26) Control, Post-Intervention: 2.42 (SEM 0.26) Baseline Post-Intervention
Baseline and postintervention social interaction frequency by condition, assessed via EMA; error bars depict SEM. Source: Lindsay et al., 2019, Fig. 2. Values from Table 1.
View chart data
Number of social interactions (1–4 scale), mean ± SEM.

ConditionBaselinePost-intervention
Monitor+Accept2.58 ± 0.212.98 ± 0.21
Monitor Only2.60 ± 0.212.55 ± 0.21
Control2.40 ± 0.262.42 ± 0.26