Module 2 — Figure candidates

Every citation in 20260731_kaep_module_2_export.md, checked against its source PDF. Organised by the module's own section headings.

83 candidate figures 93 citation checks 16 of 37 sections with sources

Intro Story2 figures

Hasenkamp et al., 2012 Figure 1
high
Hasenkamp et al., 2012 Figure 1
Source caption

Figure 1. Theoretical and analytical models of FA meditation. A) Theoretical model of dynamic cognitive states experienced during a session of FA meditation. A detailed description of this cognitive cycle is presented in the Introduction. The grey dashed line represents our hypothesized division between DMN and task-positive attention network activity during these states. B) Analytical model for construction of phases surrounding each button press (represented by the heavy black vertical line). While the button press is represented here in the middle of a TR, note that the timing of the button press within a TR will be variable. A detailed description of the phases is presented in Materials and Methods.

Panel A is the four-phase cognitive cycle itself, drawn as a loop: Mind-wandering to Awareness of MW to Shifting Attention to Sustained Focus, and back around. It is the exact model the module passage describes in prose, and the loop shape makes the key reassurance visible at a glance -- the cycle is designed to repeat, not to be escaped. Panel B shows how the button press anchors the four modeled intervals in the scanner, which covers the second half of the claim about how the study was run. This is the single highest-value figure for this section.

A helpful starting point comes from a 2012 study (Hasenkamp et al., 2012) that aimed to understand mind wandering during meditation in much finer detail... they developed a model with four phases. First, the mind wanders. Second, you become aware that the mind has wandered. Third, you shift your attention back to your object of focus. And fourth, you sustain that focus. To test this model, the researchers then asked experienced meditators to focus on their breath while lying in an fMRI scanner. Each time a meditator noticed that their mind had wandered, they pressed a button... They found that the brain data closely aligned with the meditation manuals, with different brain regions associated with each of the four phases.
Hasenkamp et al., 2012 Figure 2
high
Hasenkamp et al., 2012 Figure 2
Source caption

Figure 2. Significant activations for phases of interest. Specific contrasts are listed in each panel. A) Activations during the AWARE phase are in green (due to highly robust activations, this contrast was thresholded to p < 5.0 x 10⁻⁶). Voxels that were also significantly active during the motor control task (motor > visual; p < 0.005) are shown in red. Prominent activity was detected in dorsal ACC and frontoinsular cortex. B) Activations in lateral PFC and posterior parietal regions during the SHIFT phase. C) Activation in dorsolateral PFC during the FOCUS phase. D) Activations during MW phase included elements of DMN, as well as sensory and motor cortices and posterior insula.

This is the direct visual evidence for the claim's final sentence -- that different brain regions were associated with each of the four phases. The four stacked, colour-coded panels map one-to-one onto the four phases of the cycle in Figure 1 (AWARE green, SHIFT orange, FOCUS yellow, MW blue), so a reader who has just seen Figure 1 can read this in seconds without knowing any neuroanatomy. Pairing it with Figure 1 makes the point that the phenomenological model and the brain data line up. The colour scheme deliberately matches Figure 1, which is why the two work best presented together.

A helpful starting point comes from a 2012 study (Hasenkamp et al., 2012) that aimed to understand mind wandering during meditation in much finer detail... they developed a model with four phases. First, the mind wanders. Second, you become aware that the mind has wandered. Third, you shift your attention back to your object of focus. And fourth, you sustain that focus. To test this model, the researchers then asked experienced meditators to focus on their breath while lying in an fMRI scanner. Each time a meditator noticed that their mind had wandered, they pressed a button... They found that the brain data closely aligned with the meditation manuals, with different brain regions associated with each of the four phases.
Banerjee et al., 2017
none
No figure

PDF is missing from the source folder. Verified by directory listing of /Users/corbin/Downloads/20260802-Module-2-PDFs/ -- there is no file matching 'Banerjee' or any partial variant, and the pre-scanned caption index (all_figs.jsonl) contains no corresponding entry. No figure could be assessed. The course authors will need to supply the PDF if they want this citation illustrated.

PDF not in the folder
When thoughts and distractions inevitably continue to arise, they feel that they are meditating incorrectly, conclude, 'I can't do this,' and stop practicing (Banerjee et al., 2017).
Lomas et al., 2015
none
No figure

This is a text-only qualitative interview study of 30 male meditators. The PDF contains zero embedded images and no figures of any kind across all 13 pages; the sole exhibit is Table 1, a sociodemographic and practice-experience breakdown of the sample (age bands, years of practice, tradition). The brief explicitly deprioritises sample demographic tables, and it carries no information supporting the specific claim about meditators falsely expecting a quiet mind. That claim is supported only by interview quotations in the running text, which would be better reproduced as a pull quote than as a figure.

Many people think, 'I can't stop my thoughts,' because they falsely assume meditation should completely quiet the mind from the outset (Lomas et al., 2015).

Introductory meditation instructions0 figures

No citations in this section of the module text.

Kindness and warmth meditation as skill building5 figures

Dahl et al., 2015 Table 1
high
Dahl et al., 2015 Table 1
Source caption

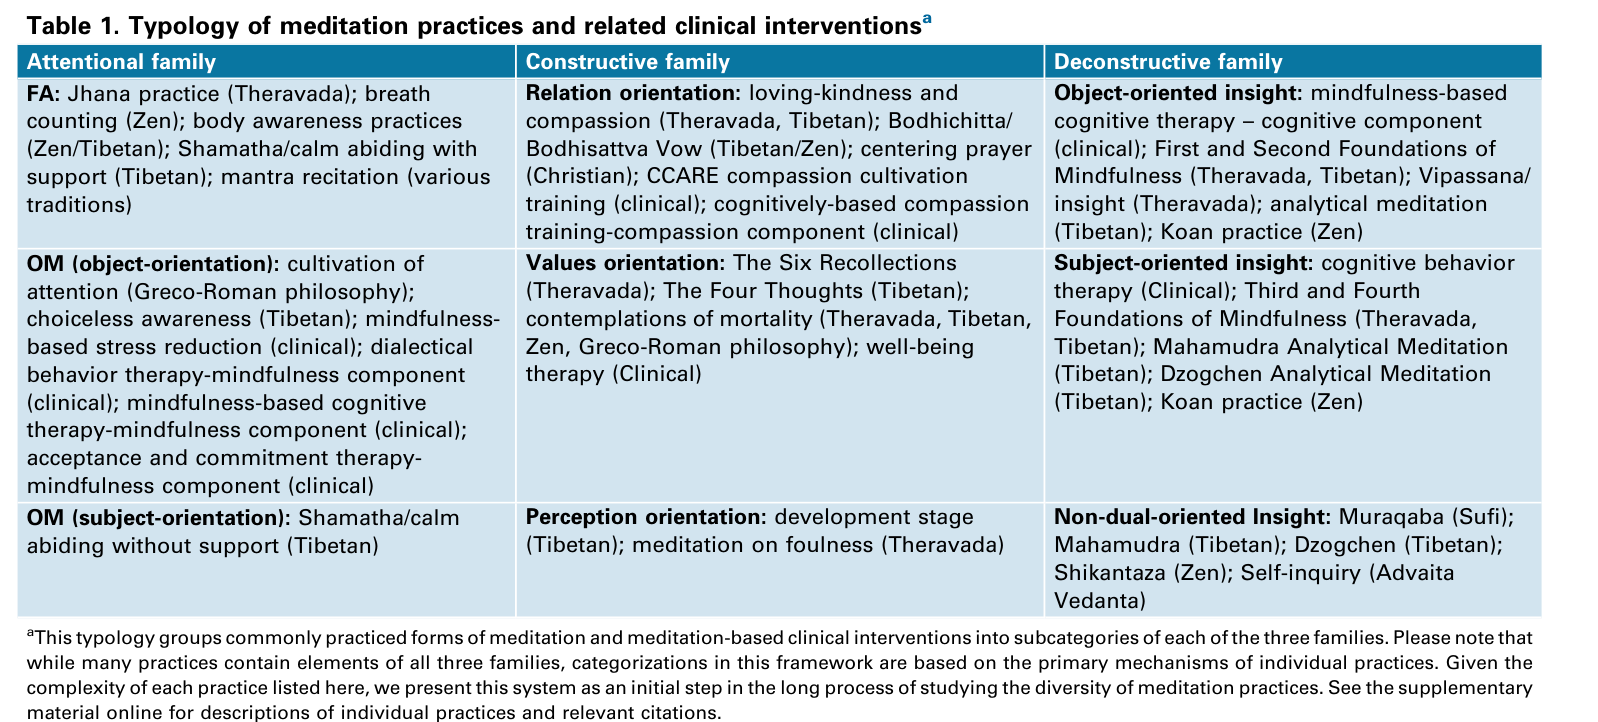
Table 1. Typology of meditation practices and related clinical interventionsᵃ ᵃThis typology groups commonly practiced forms of meditation and meditation-based clinical interventions into subcategories of each of the three families. Please note that while many practices contain elements of all three families, categorizations in this framework are based on the primary mechanisms of individual practices. Given the complexity of each practice listed here, we present this system as an initial step in the long process of studying the diversity of meditation practices. See the supplementary material online for descriptions of individual practices and relevant citations.

This is the source table for the three-column taxonomy the module reproduces: attentional, constructive, and deconstructive families, each broken into named sub-orientations with concrete example practices. Loving-kindness and compassion appear explicitly as the first entry under 'Relation orientation' in the constructive family, which anchors the module's placement of LKM. A clinician can scan it in under 20 seconds and immediately see where familiar practices (MBSR, MBCT, ACT, vipassana, centering prayer) sit within the framework. Note the footnote's own caveat that most practices contain elements of all three families, which is exactly the module's point about LKM engaging all three at once.

meditative fitness consists of three broad families of skills. The attentional family cultivates monitoring and focusing; the constructive family builds warmth and compassion; and the deconstructive family trains letting go (Dahl et al., 2015). While many other types of meditation might be more specialized, LKM engages all three at once.
Van Cappellen et al., 2020 Figure 1
high
Van Cappellen et al., 2020 Figure 1
Source caption

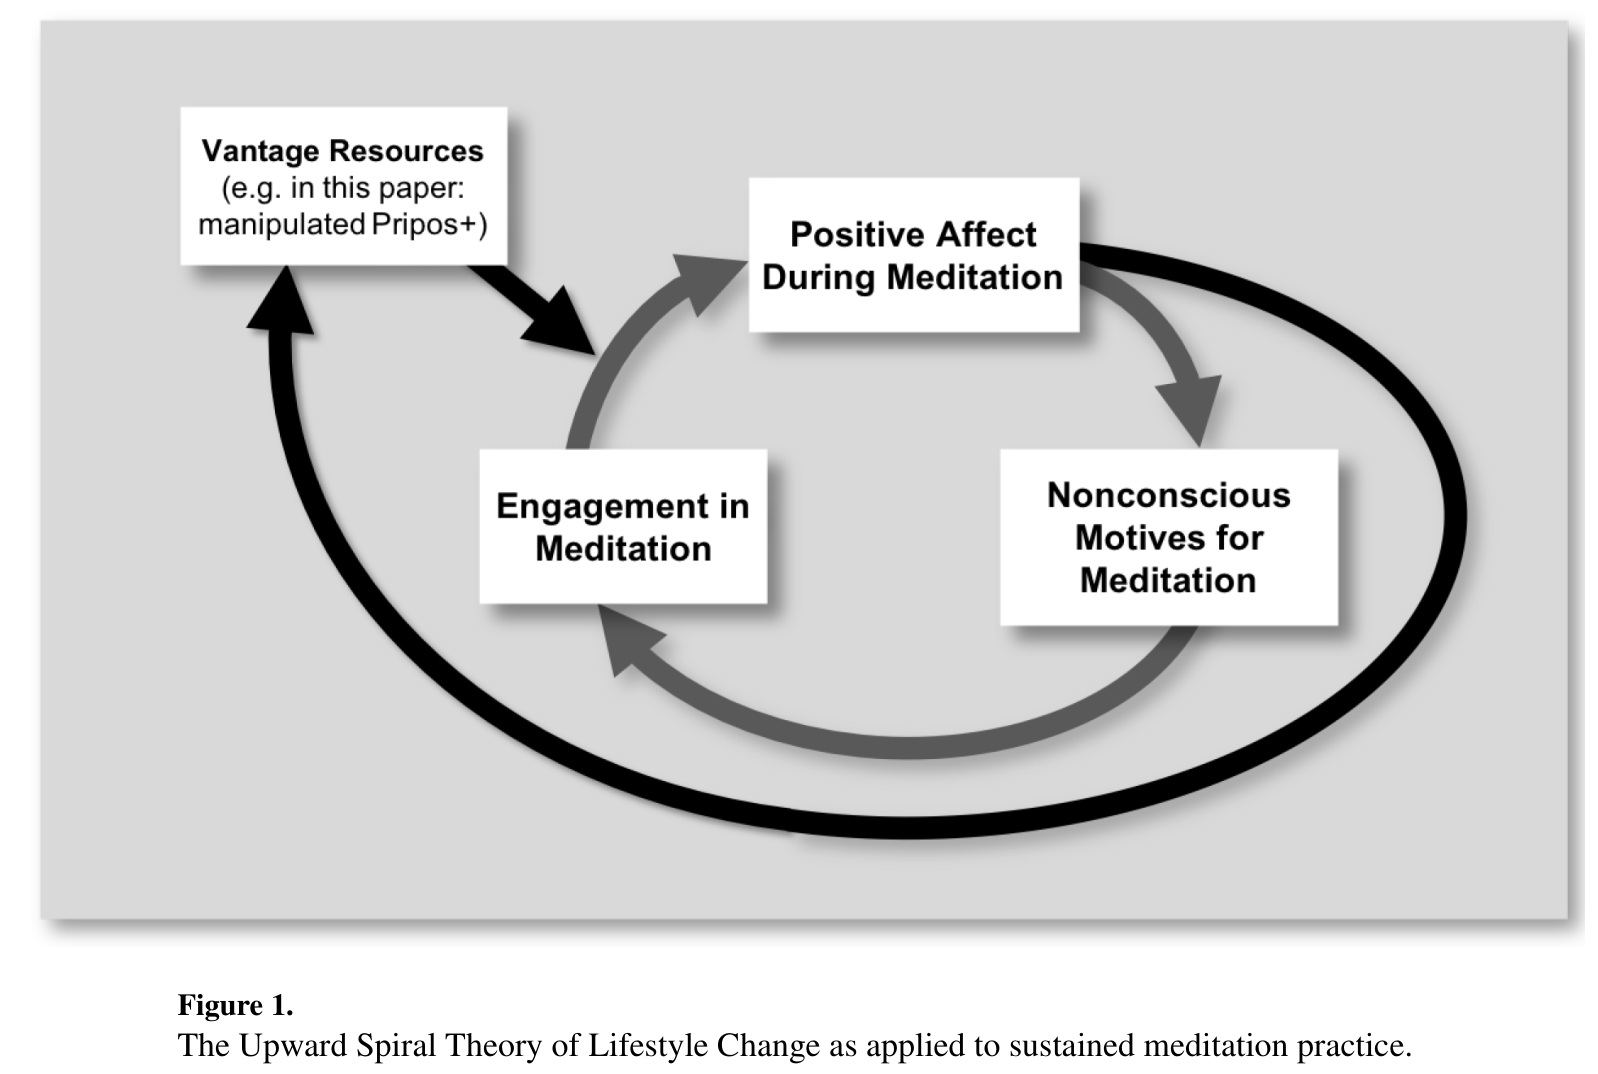
Figure 1. The Upward Spiral Theory of Lifestyle Change as applied to sustained meditation practice.

A four-box loop diagram: engagement in meditation produces positive affect during meditation, which builds nonconscious motives for meditation, which feeds back into more engagement. This is a direct visual statement of the module's causal claim that finding a practice rewarding is what sustains it, rather than willpower or discipline. It is the clearest single image in the batch for explaining why intrinsic reward was the selection criterion for LKM.

we chose LKM because many people find it intrinsically rewarding, which helps generate motivation to continue practicing (Fredrickson et al., 2008; Van Cappellen et al., 2020).
Van Cappellen et al., 2020 Figure 2
high
Van Cappellen et al., 2020 Figure 2
Source caption

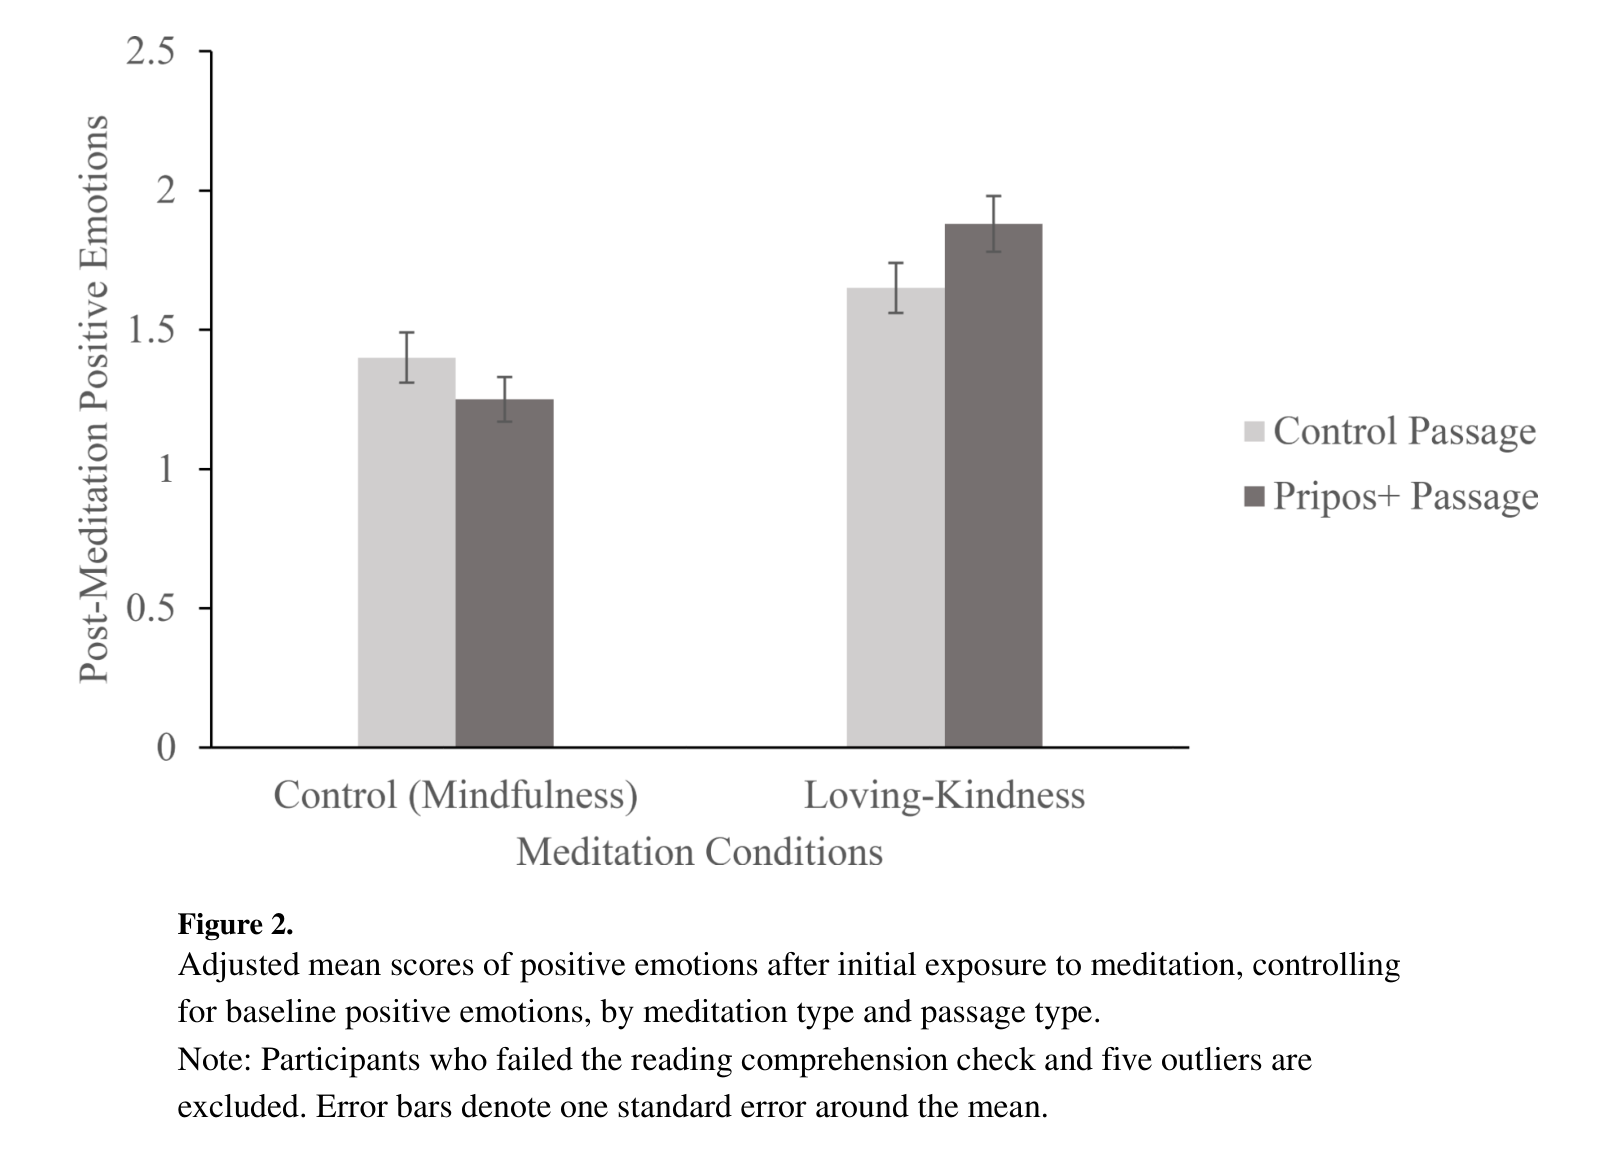
Figure 2. Adjusted mean scores of positive emotions after initial exposure to meditation, controlling for baseline positive emotions, by meditation type and passage type. Note: Participants who failed the reading comprehension check and five outliers are excluded. Error bars denote one standard error around the mean.

A simple four-bar chart showing that a first exposure to loving-kindness meditation produced markedly higher post-meditation positive emotions than the mindfulness control condition, with non-overlapping standard error bars. This is the specific evidence behind 'we chose LKM' rather than another practice: LKM was the more enjoyable of the two on first contact. The second factor (control vs Pripos+ passage) is the paper's micro-intervention manipulation and is incidental to the module's claim, so the caption may need a one-line gloss for readers.

we chose LKM because many people find it intrinsically rewarding, which helps generate motivation to continue practicing (Fredrickson et al., 2008; Van Cappellen et al., 2020).
Van Cappellen et al., 2020 Figures 3a-b
high
Van Cappellen et al., 2020 Figures 3a-b
Source caption

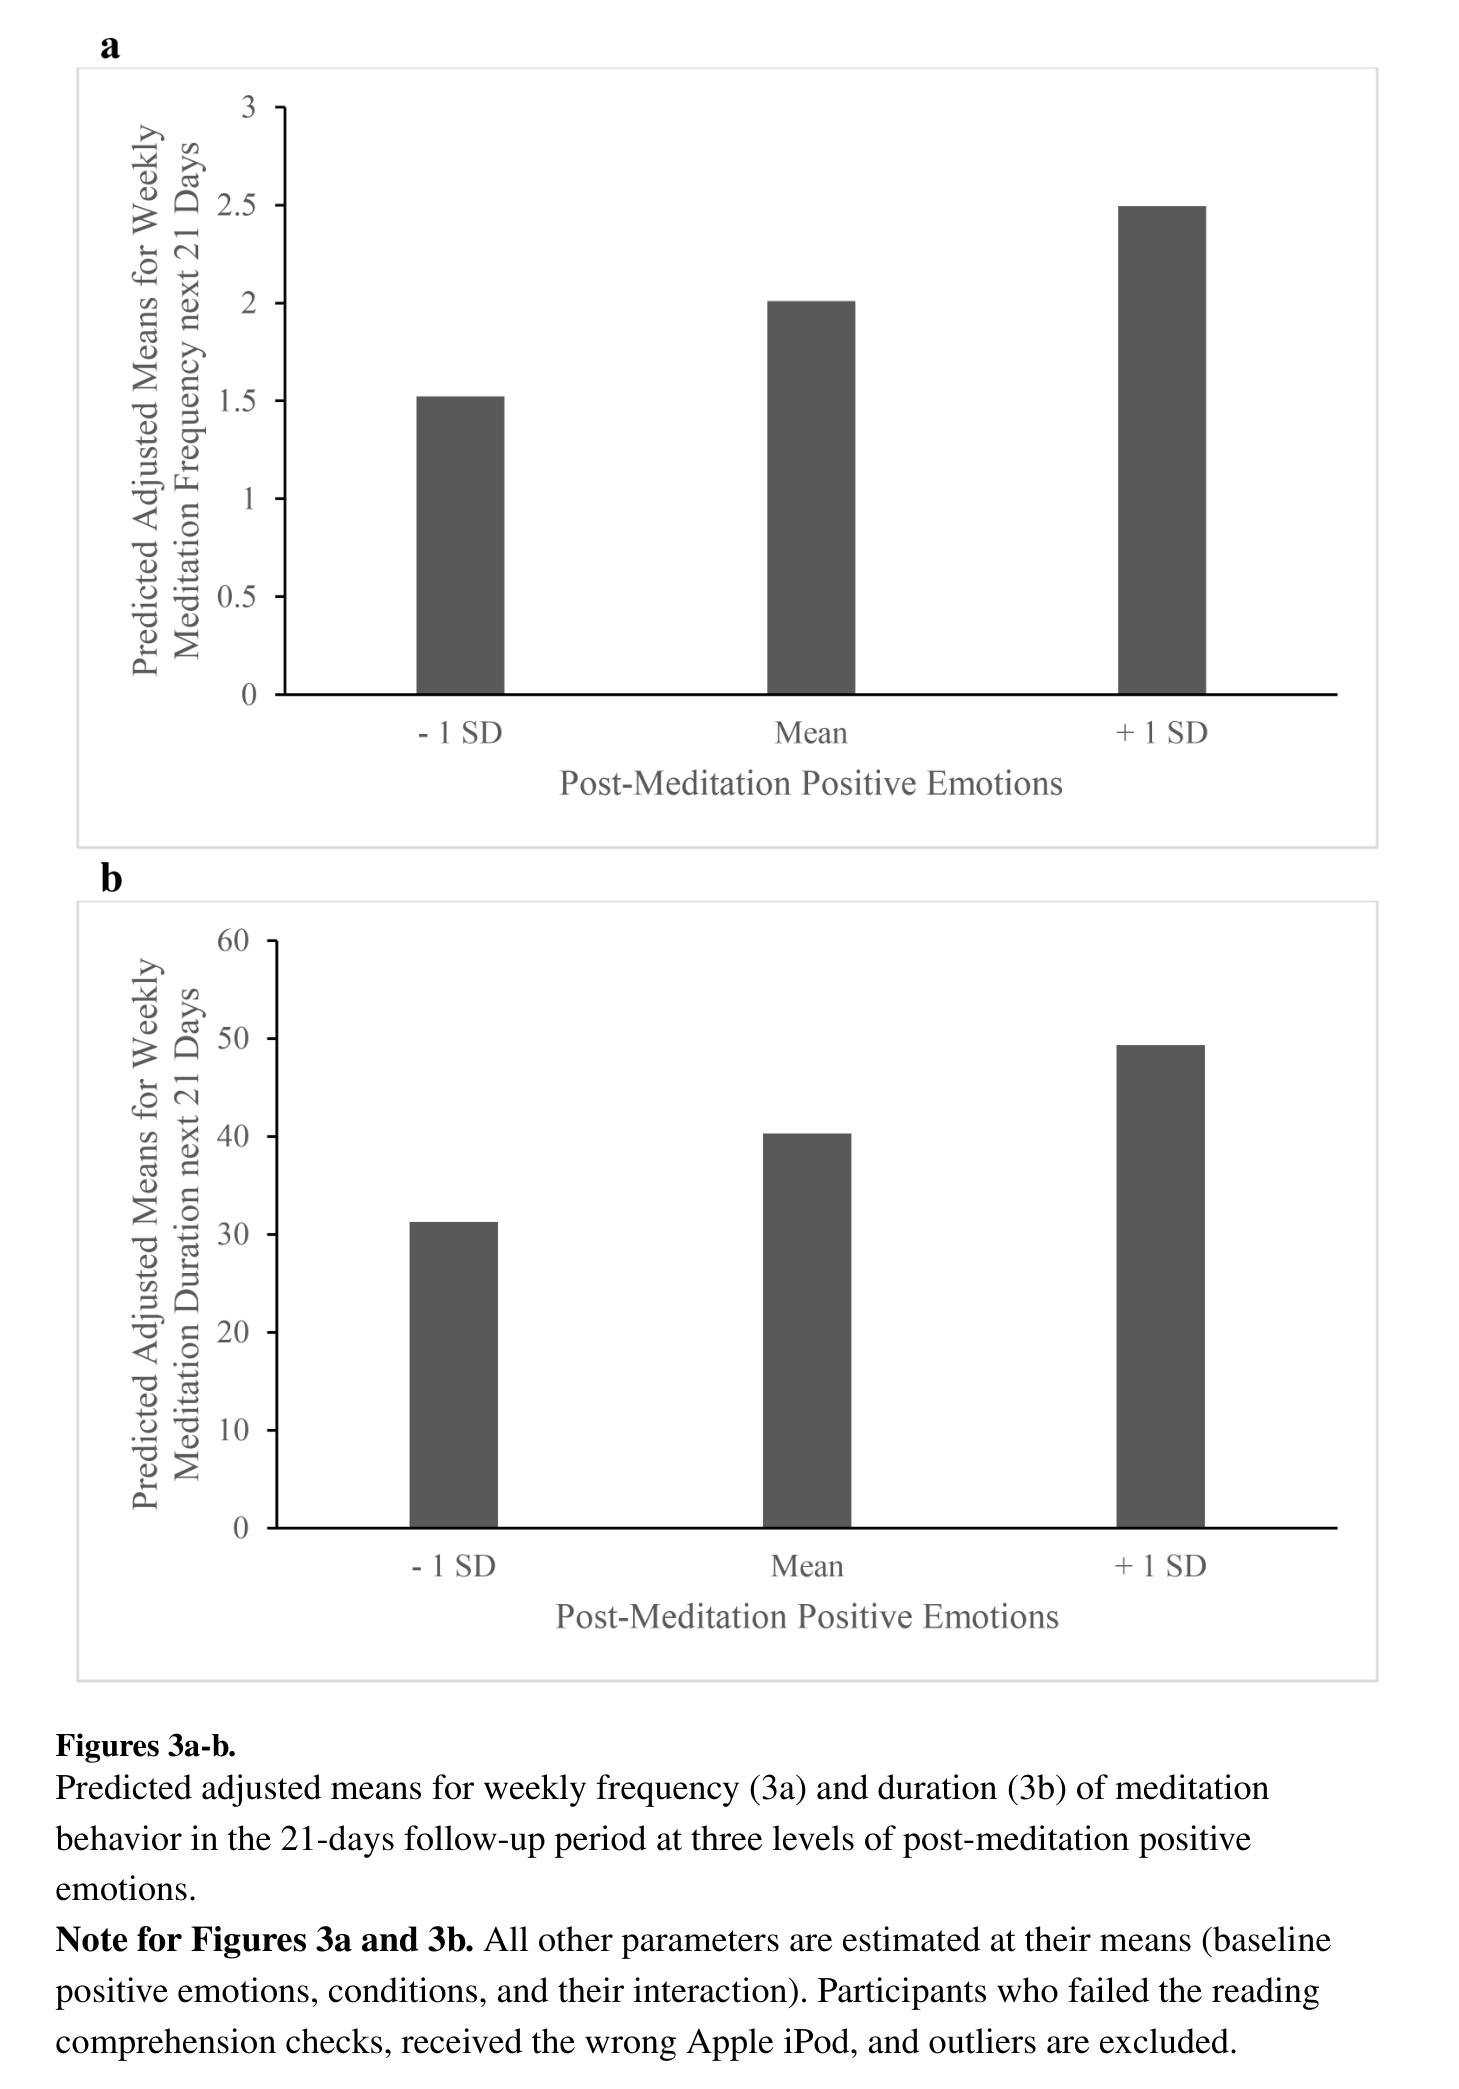
Figures 3a-b. Predicted adjusted means for weekly frequency (3a) and duration (3b) of meditation behavior in the 21-days follow-up period at three levels of post-meditation positive emotions. Note for Figures 3a and 3b. All other parameters are estimated at their means (baseline positive emotions, conditions, and their interaction). Participants who failed the reading comprehension checks, received the wrong Apple iPod, and outliers are excluded.

Two stacked bar charts showing that the more positive emotion people felt right after meditating, the more often (1.5 to 2.5 sessions per week) and the longer (31 to 49 minutes per week) they actually meditated over the next three weeks. This is the 'continued practice' half of the module's claim shown as behaviour, not self-report intention, and it completes the loop asserted in Figure 1. If only one Van Cappellen figure is used, Figure 1 is the better conceptual anchor; this one is the better empirical payoff.

we chose LKM because many people find it intrinsically rewarding, which helps generate motivation to continue practicing (Fredrickson et al., 2008; Van Cappellen et al., 2020).
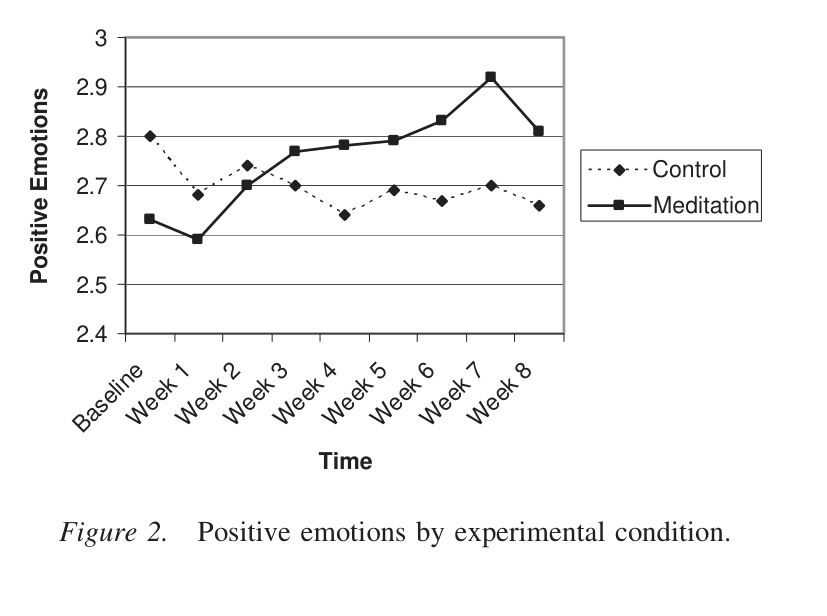
Fredrickson et al., 2008 Figure 2
medium
Fredrickson et al., 2008 Figure 2
Source caption

Figure 2. Positive emotions by experimental condition.

A line graph of daily positive emotion over baseline plus eight weeks, showing a steady upward trajectory for the LKM group while the waitlist control stays flat. It supports the 'intrinsically rewarding' claim indirectly: the practice itself makes practitioners feel better week over week, which is the reward that would sustain motivation. Honest caveat, this study measured positive emotion, not enjoyment of or adherence to the practice, so Van Cappellen Figures 2 and 3 map onto the sentence more tightly. The y-axis range is narrow (2.4 to 3.0 on a 5-point scale), so the visual slope overstates a real but modest effect.

we chose LKM because many people find it intrinsically rewarding, which helps generate motivation to continue practicing (Fredrickson et al., 2008; Van Cappellen et al., 2020).

Cultivating warmth as an evidence-based foundation for advanced meditation8 figures

Fredrickson et al., 2008 Figure 1
high
Fredrickson et al., 2008 Figure 1
Source caption

Figure 1. Conceptual model depicting predicted causal paths between loving-kindness meditation, change in positive emotions, change in resources, and change in life satisfaction.

A four-box left-to-right chain: loving-kindness meditation, increases in positive emotions, increase in resource, increase in life satisfaction. This is precisely the two-stage structure the module sentence asserts, immediate emotional lift first and durable resources second, rendered in a form a busy clinician grasps instantly. It also makes explicit that the resource-building is mediated by positive emotion rather than being a direct effect of the practice, which is the paper's actual finding.

Even brief practices can produce immediate increases in social connection and positive emotion, while sustained training may build more durable internal resources, including meaning, resilience, physiological regulation, and well-being (Fredrickson et al., 2008).
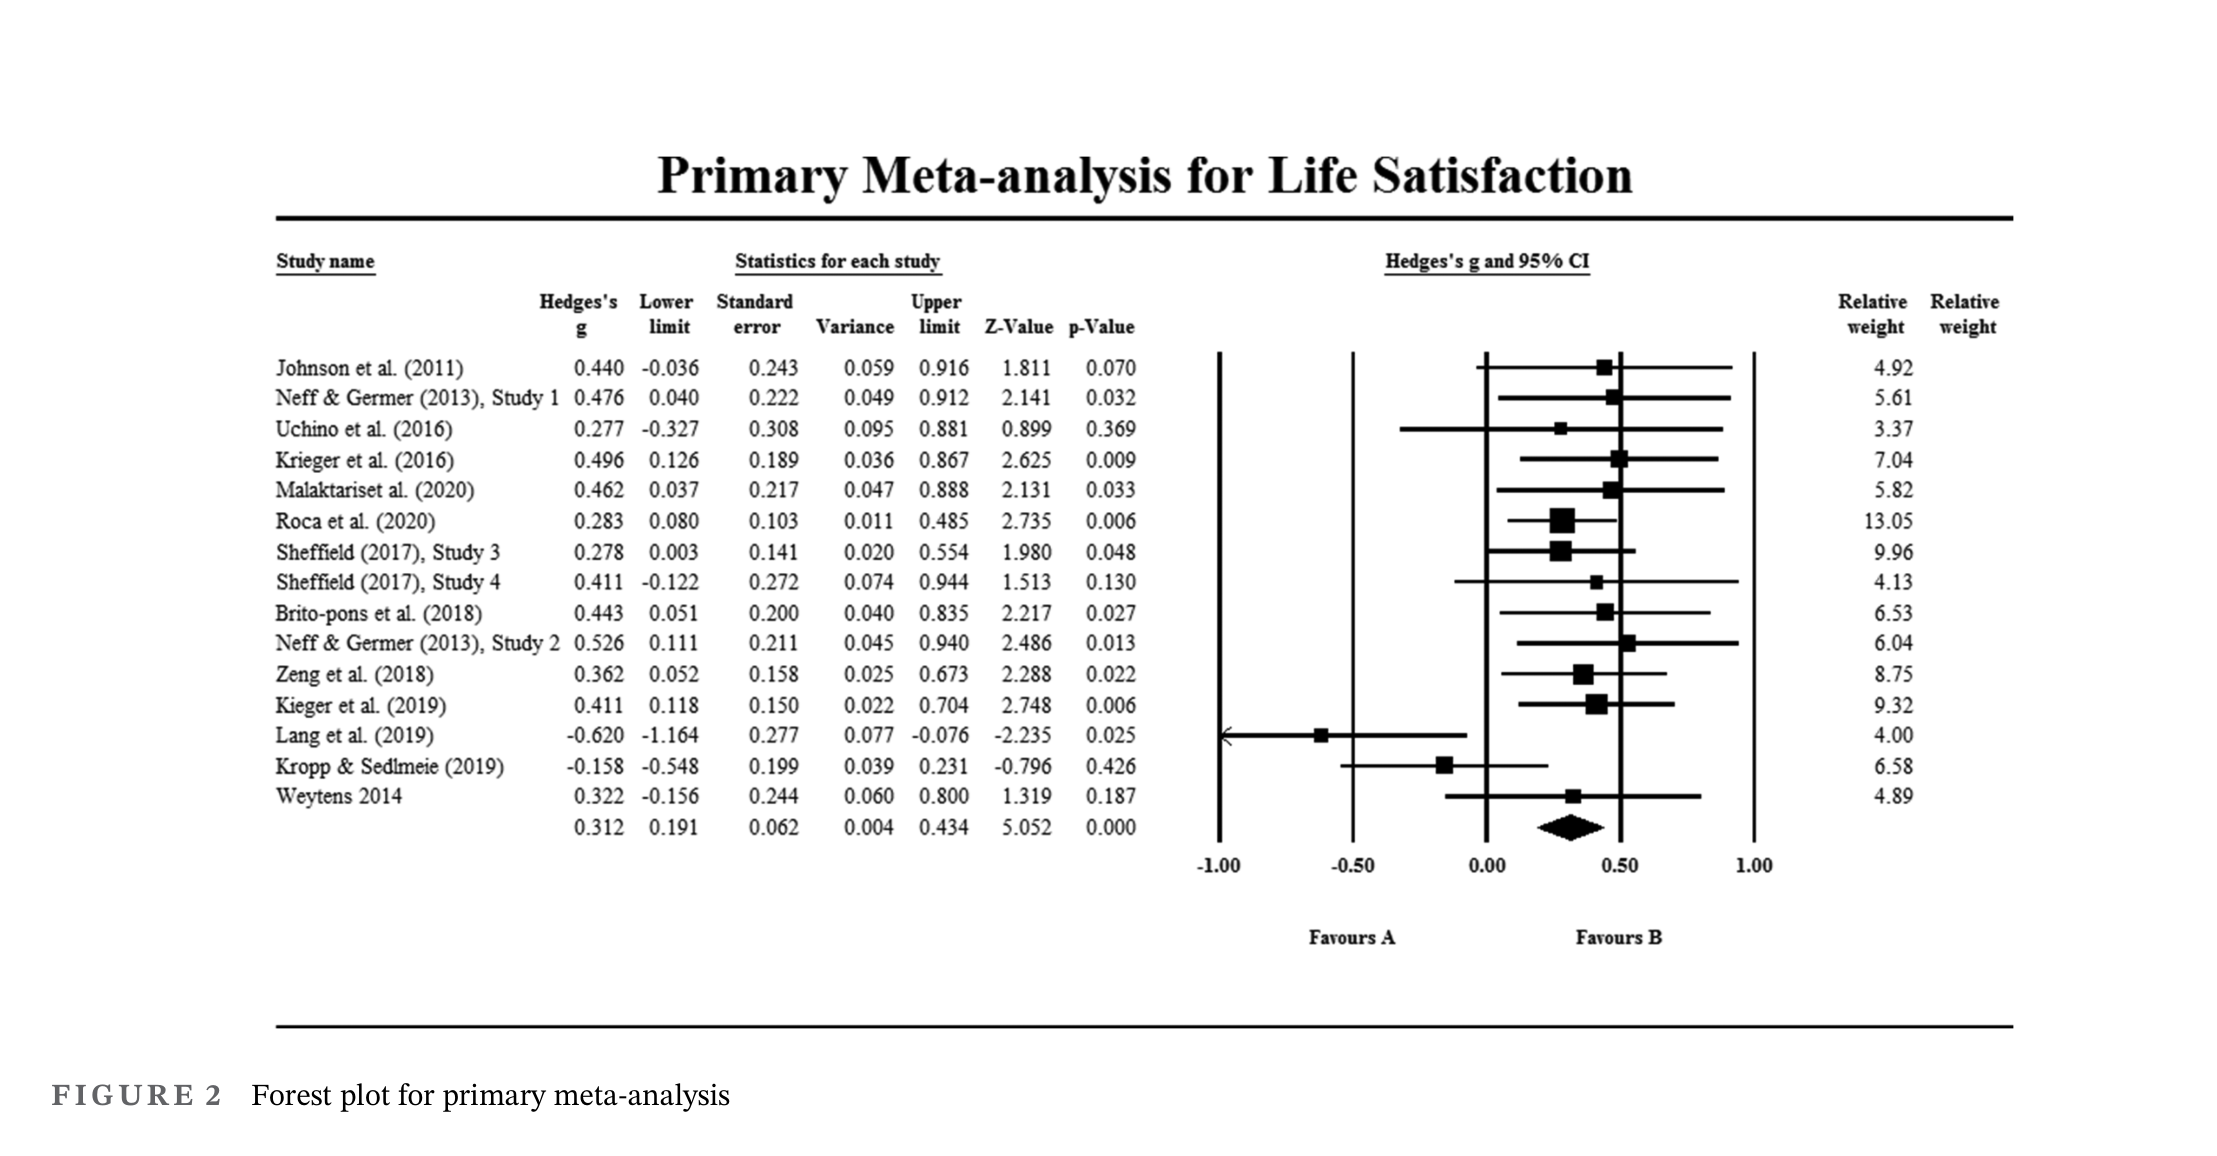
Gu et al., 2022 FIGURE 2
high
Gu et al., 2022 FIGURE 2
Source caption

FIGURE 2 Forest plot for primary meta-analysis

Titled in-figure as 'Primary Meta-analysis for Life Satisfaction,' this forest plot pools 15 trials of loving-kindness and compassion meditation to Hedges' g = 0.312 (95% CI 0.191-0.434, p < .001), and is the specific evidence for the life-satisfaction half of the claim, complementing the Zheng anxiety plot rather than duplicating it. Two production notes: the figure is printed sideways in the PDF, so the shipped crop has been rotated 90 degrees to upright, and the axis is labelled only 'Favours A / Favours B', which should be relabelled to control/LKM for a lay reader. Honest caveat: the RCT-only subset (Fig. 4, p. 12, six trials) was non-significant at g = 0.106, p = .520, so the life-satisfaction effect rests largely on non-randomised trials.

systematic reviews and meta-analyses linking LKM to reduced depression and anxiety and greater life satisfaction.
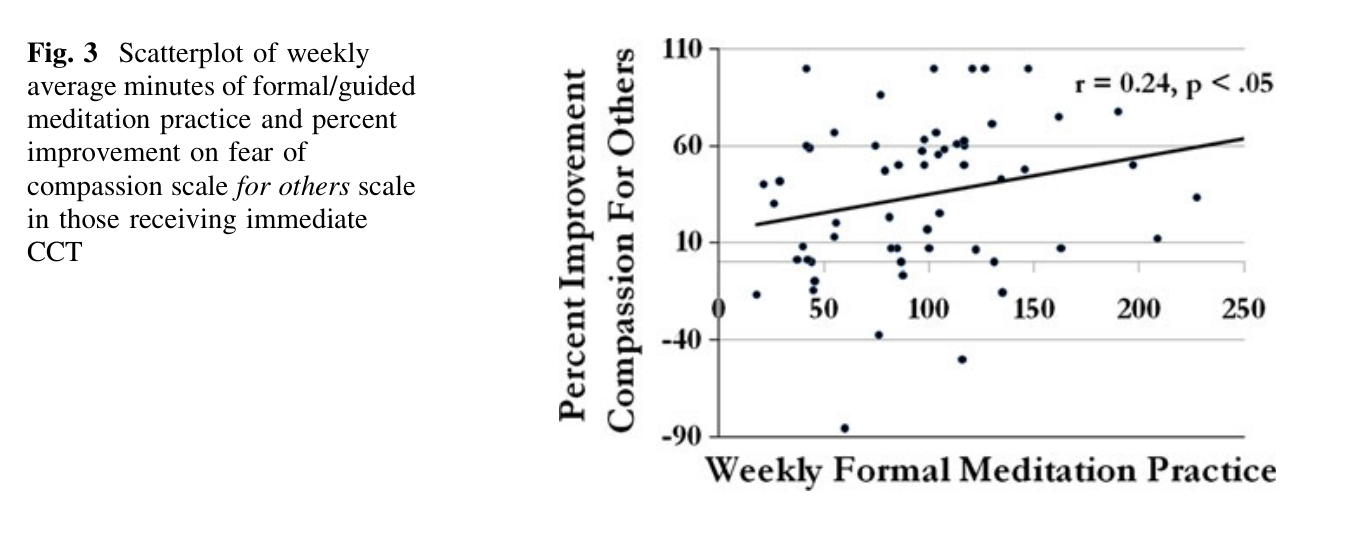
Jazaieri et al., 2014 Fig. 3
high
Jazaieri et al., 2014 Fig. 3
Source caption

Fig. 3 Scatterplot of weekly average minutes of formal/guided meditation practice and percent improvement on fear of compassion scale for others scale in those receiving immediate CCT

This is the dose-response figure the module's second sentence is actually about: each dot is one CCT participant, the x-axis is weekly minutes of formal meditation practice and the y-axis is percent improvement, with a rising fit line annotated r = 0.24, p < .05. It is the most persuasive single image in this batch for the module's core pedagogical point that warmth is trainable and that more practice yields more change, and a clinician reads it instantly. One honesty note for the authors: the practice-amount correlation held only for compassion for others (p > .09, > .43, > .10 for the other three scales), so the relationship is real but narrow and the scatter is wide.

A randomized controlled trial found that compassion cultivation training, a practice similar to loving-kindness meditation, increased mindfulness and happiness while reducing worry. Participants who practiced more also tended to experience greater improvements, further suggesting that these capacities strengthen through repeated practice (Jazaieri et al., 2014).
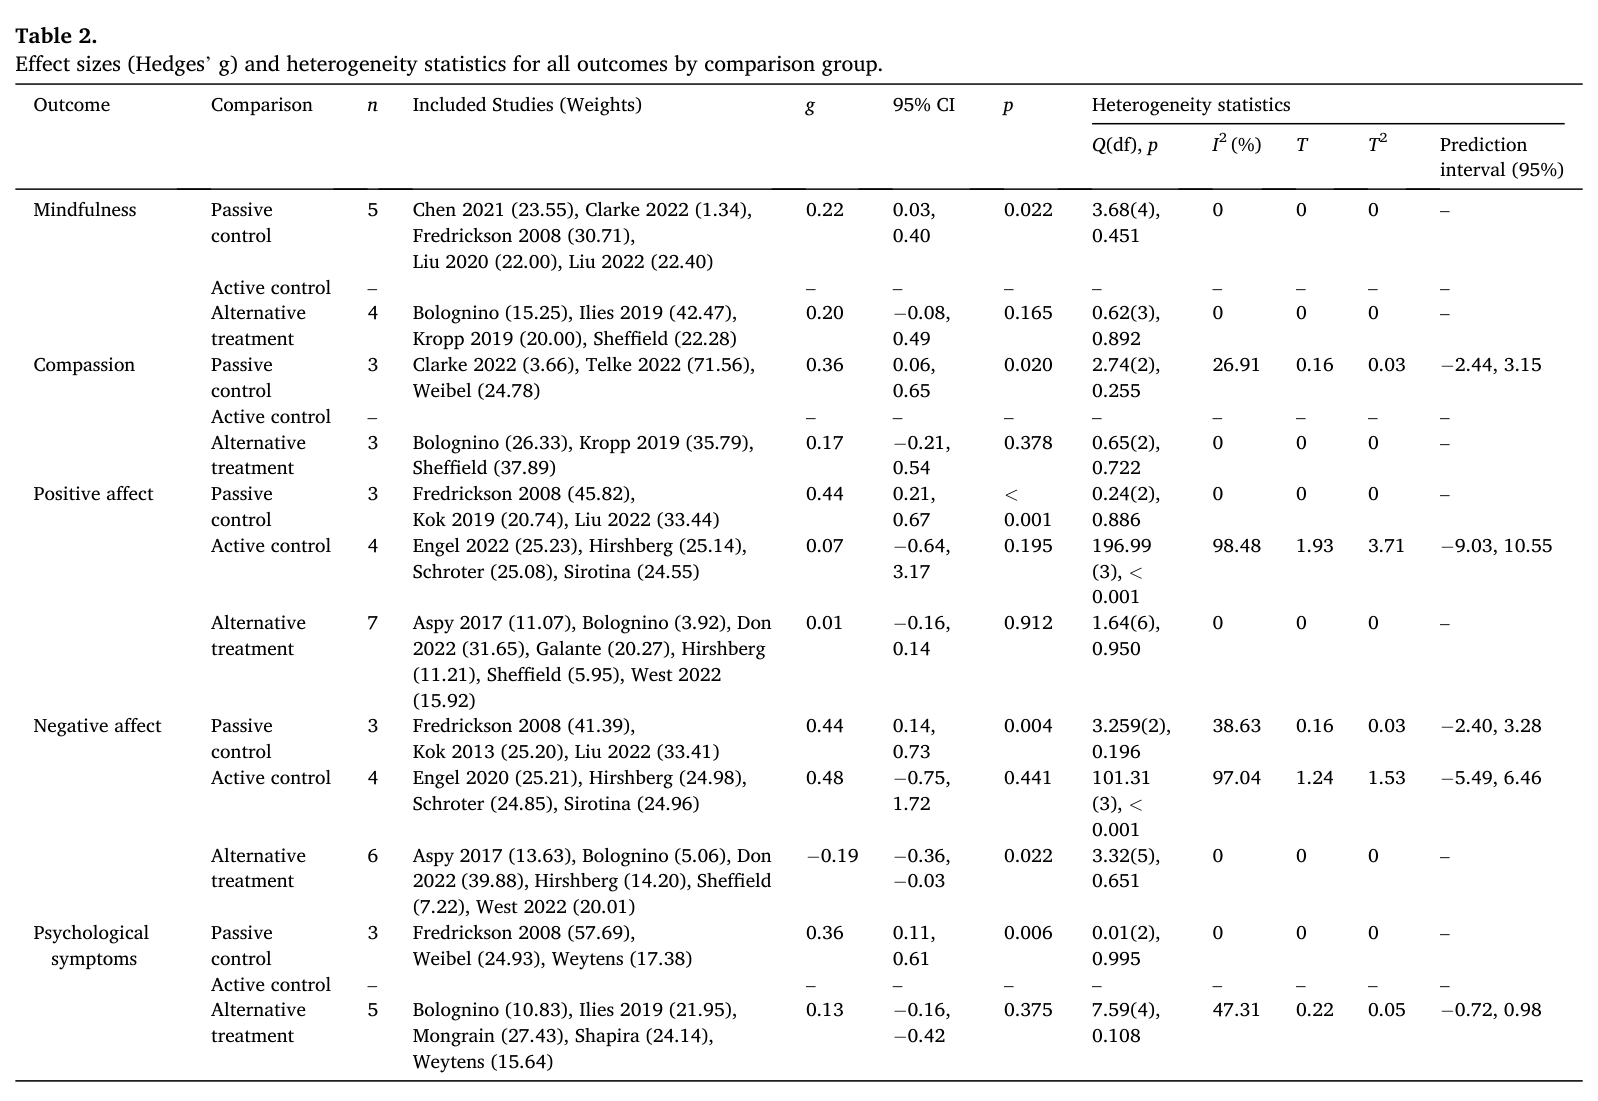
Petrovic et al., 2024 Table 2
high
Petrovic et al., 2024 Table 2
Source caption

Table 2. Effect sizes (Hedges' g) and heterogeneity statistics for all outcomes by comparison group.

This paper publishes no forest plot, so its Table 2 is the only figure that carries the pooled result, and it maps one-to-one onto the module sentence: against passive control, mindfulness g = 0.22 (p = .022), compassion g = 0.36 (p = .020), positive affect g = 0.44 (p < .001), negative affect g = 0.44 (p = .004), and psychological symptoms g = 0.36 (p = .006). A reader can scan the passive-control rows and see all five claimed outcomes improve with small-to-moderate effects. It is the densest item in this batch and the heterogeneity columns are specialist material, so consider reproducing only the Outcome / Comparison / n / g / 95% CI / p columns. Honest caveat visible in the same table: against active controls and alternative treatments most effects shrink to non-significance, which the module text does not currently mention.

A 2024 systematic review and meta-analysis found that LKM interventions increased positive emotions, mindfulness, compassion, and reduced adverse psychological symptoms (Petrovic et al., 2024).
Zeng et al., 2015 FIGURE 2
high
Zeng et al., 2015 FIGURE 2
Source caption

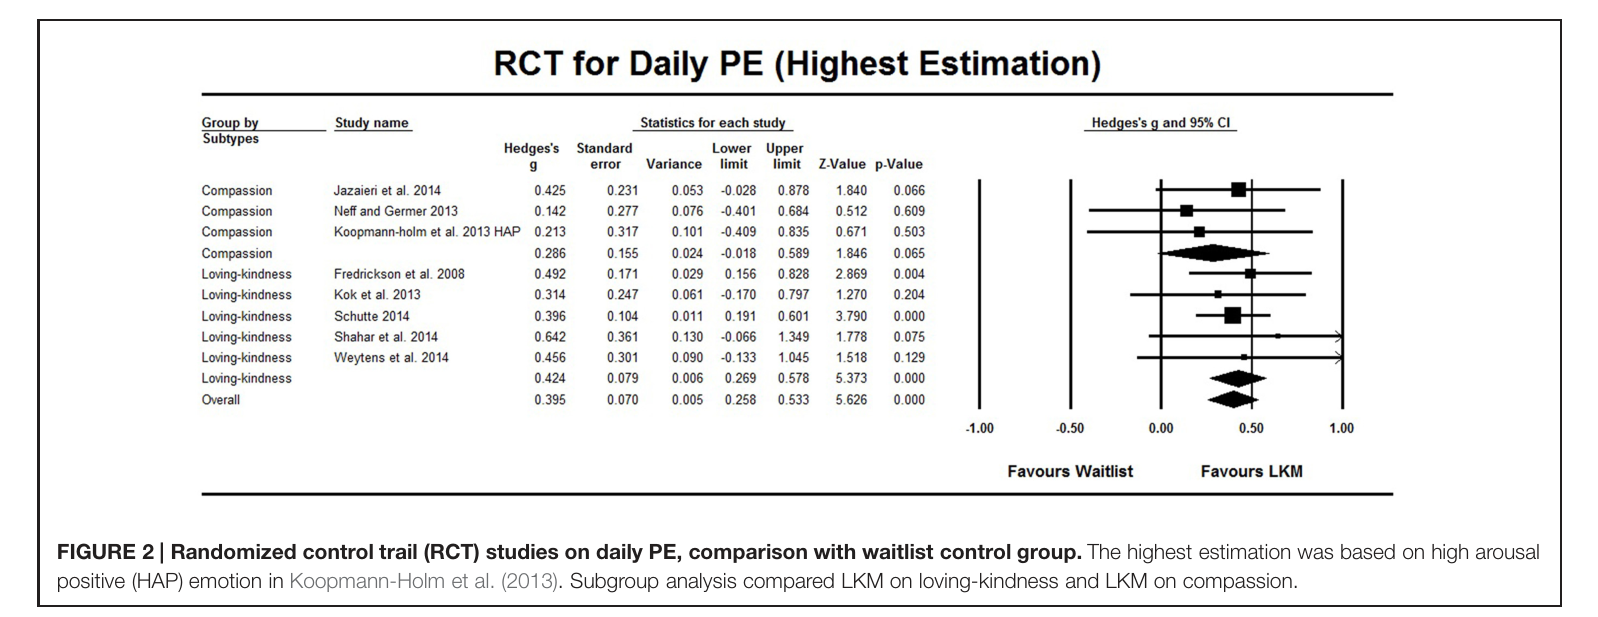
FIGURE 2 | Randomized control trail (RCT) studies on daily PE, comparison with waitlist control group. The highest estimation was based on high arousal positive (HAP) emotion in Koopmann-Holm et al. (2013). Subgroup analysis compared LKM on loving-kindness and LKM on compassion.

A clean forest plot of nine randomised trials of LKM versus waitlist on daily positive emotion, with an overall Hedges' g of 0.395 (95% CI 0.258-0.533) sitting clearly on the 'Favours LKM' side of zero. The explicit 'Favours Waitlist / Favours LKM' axis labels make it readable in seconds by a clinician who has never seen a forest plot, and the loving-kindness vs. compassion subgroups show the effect holds for both framings of the practice. This is the single best visual anchor for the 'increases positive emotion' half of the module sentence, and it can carry the Galante co-citation too since that paper's own forest plots are missing. Note Figures 3-5 and 7-8 in this same paper are near-duplicate sensitivity/non-RCT reruns of the same data and would be redundant with this one; Figure 6 pools only two studies.

Systematic reviews and clinical trials indicate that loving-kindness and compassion meditation can increase positive emotion, mindfulness, and life satisfaction while also reducing symptoms of depression and anxiety (Galante et al., 2014; Zeng et al., 2015).
Zheng et al., 2023 Fig. 2
high
Zheng et al., 2023 Fig. 2
Source caption

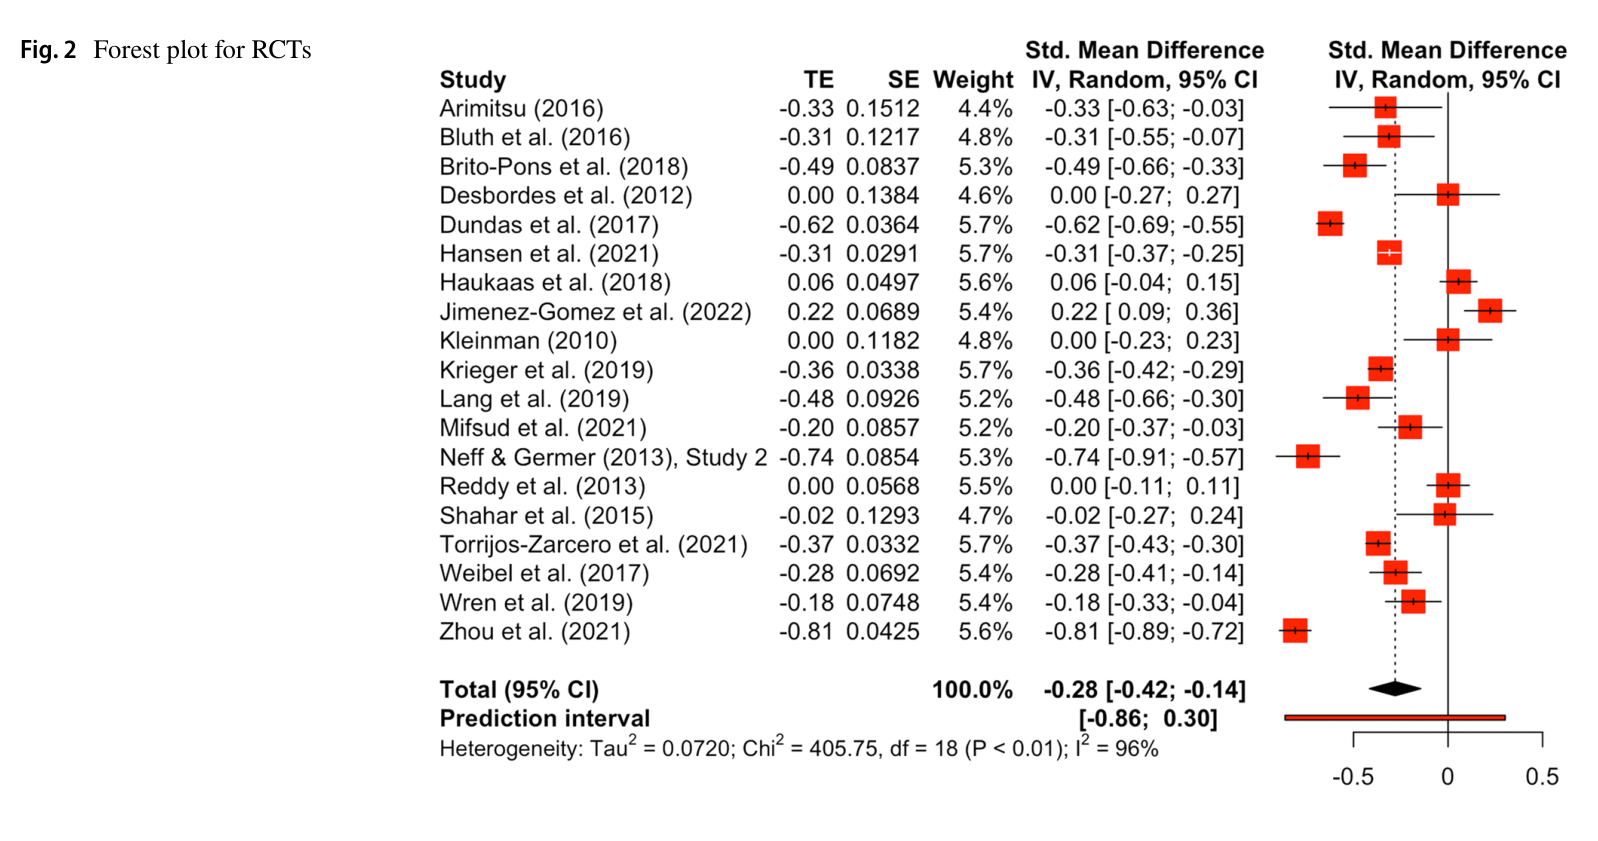
Fig. 2 Forest plot for RCTs

The RCT forest plot from 'Effects of Loving-Kindness and Compassion Meditation on Anxiety,' pooling 19 randomised trials to a standardised mean difference of -0.28 (95% CI -0.42 to -0.14), i.e. a small but reliable reduction in anxiety. The red weighted squares and clear zero line make the direction obvious at a glance, and it is the direct evidentiary backing for the 'reduced anxiety' half of this claim. The visible caveats are worth keeping if reproduced: I-squared = 96% and a prediction interval of [-0.86, 0.30] that crosses zero. I deliberately skipped this paper's Fig. 4 (non-randomised trials, p. 9) as redundant with this one and less legible, since a single outlier at -2.36 stretches its axis to plus or minus 3 and squashes every other study.

systematic reviews and meta-analyses linking LKM to reduced depression and anxiety and greater life satisfaction.
Fredrickson et al., 2008 Table 5
medium
Fredrickson et al., 2008 Table 5
Source caption

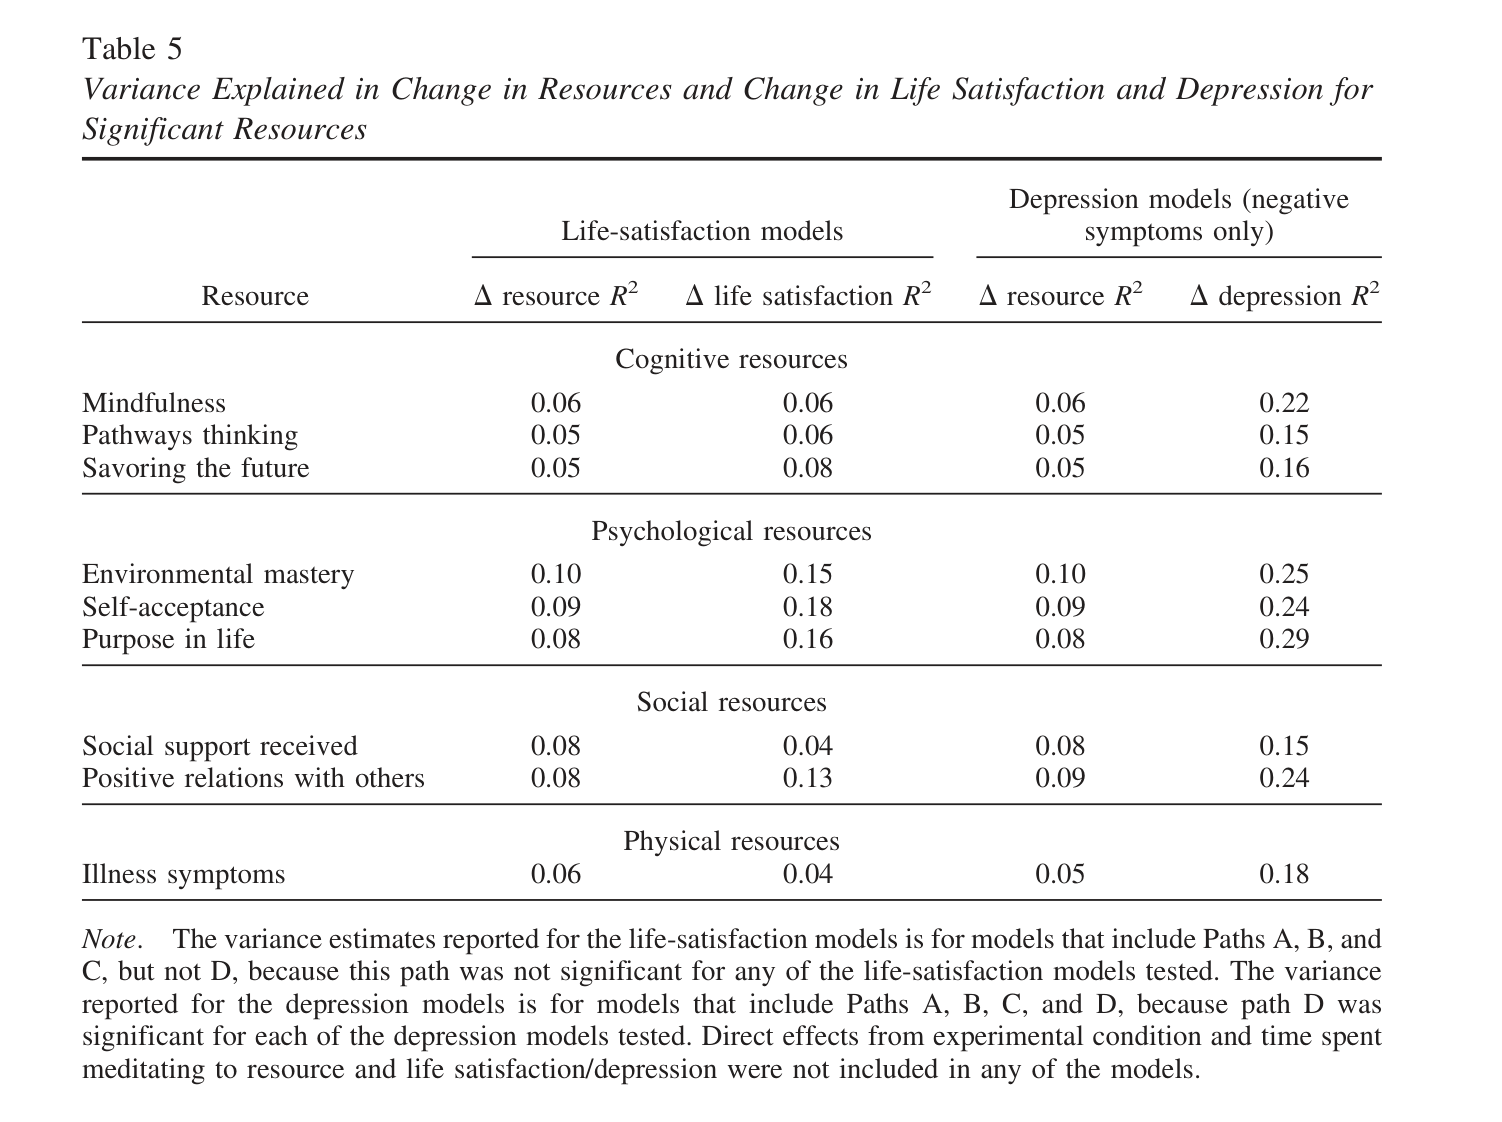
Table 5 Variance Explained in Change in Resources and Change in Life Satisfaction and Depression for Significant Resources Note. The variance estimates reported for the life-satisfaction models is for models that include Paths A, B, and C, but not D, because this path was not significant for any of the life-satisfaction models tested. The variance reported for the depression models is for models that include Paths A, B, C, and D, because path D was significant for each of the depression models tested. Direct effects from experimental condition and time spent meditating to resource and life satisfaction/depression were not included in any of the models.

This table names the specific resources that LKM actually built, grouped as cognitive (mindfulness, pathways thinking, savoring the future), psychological (environmental mastery, self-acceptance, purpose in life), social (social support received, positive relations with others), and physical (illness symptoms). Those four headings map almost one-for-one onto the module's list of meaning, resilience, physiological regulation, and well-being, so it turns an abstract phrase into a concrete inventory. The R-squared columns are the technical part and the effect sizes are small (0.04 to 0.29), so if reproduced it may be worth showing the resource names and letting the caption carry the magnitudes.

Even brief practices can produce immediate increases in social connection and positive emotion, while sustained training may build more durable internal resources, including meaning, resilience, physiological regulation, and well-being (Fredrickson et al., 2008).
Jazaieri et al., 2014 Fig. 2
medium
Jazaieri et al., 2014 Fig. 2
Source caption

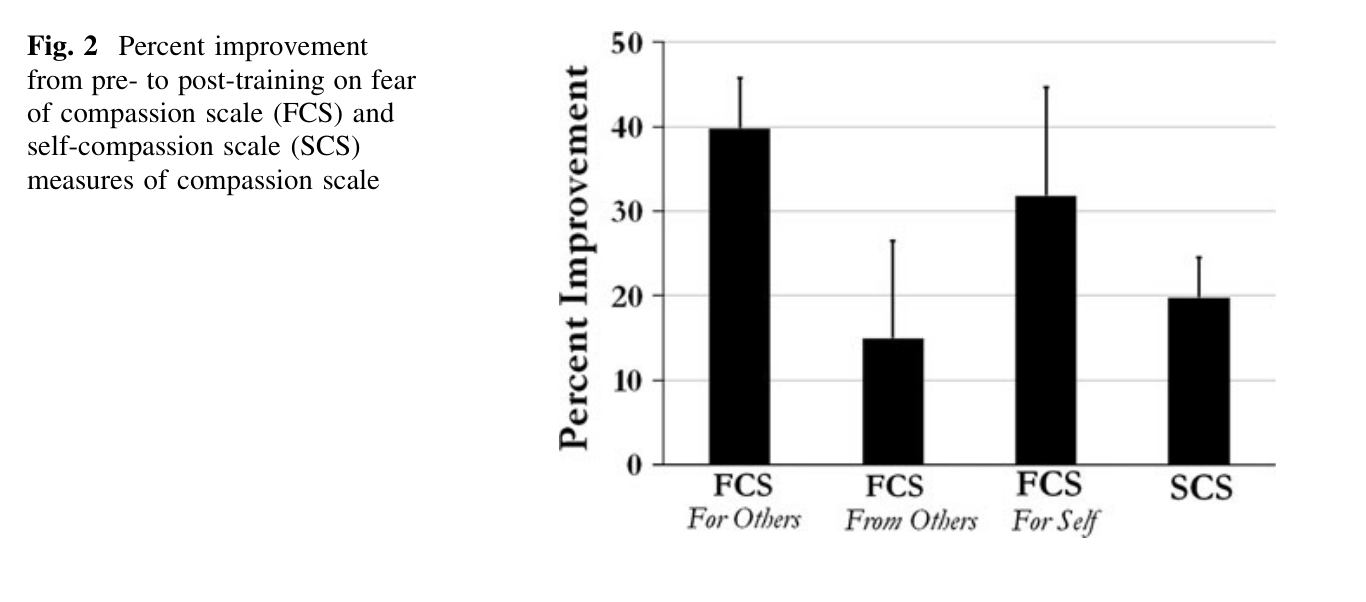
Fig. 2 Percent improvement from pre- to post-training on fear of compassion scale (FCS) and self-compassion scale (SCS) measures of compassion scale

A simple four-bar chart of percent improvement across the trial's compassion outcomes, showing the largest gain in compassion for others (~40%), then compassion for self (~32%), self-compassion (~20%), and receiving compassion from others (~15%). It is the most legible single summary of the RCT's headline result and pairs naturally with the dose-response scatterplot. Flagged medium rather than high because of a citation mismatch the authors should resolve: this PDF is Jazaieri et al. 2013, 'Enhancing Compassion,' whose outcomes are the three compassion orientations, whereas the module sentence describes mindfulness, happiness, and worry, which are the outcomes of the companion 2014 paper on the same CCT trial. The figure therefore supports the 'CCT works and is trainable' thrust but not literally the mindfulness/happiness/worry wording.

A randomized controlled trial found that compassion cultivation training, a practice similar to loving-kindness meditation, increased mindfulness and happiness while reducing worry. Participants who practiced more also tended to experience greater improvements, further suggesting that these capacities strengthen through repeated practice (Jazaieri et al., 2014).
Galante et al., 2014
none
No figure

This copy is the APA-style accepted-manuscript version, not the typeset journal article. Its only figure is Figure 1 (p. 35), a study-selection flow chart of the kind the brief tells us to skip. Every effect-size result lives in 'Supplemental Tables 1-10' and 'Supplemental Figures 2, 4, 6, 8' that are referenced in the text (e.g. p. 21) but are not bundled in this PDF, so the meta-analytic forest plots are simply unavailable here. The remaining tables (Table 1, pp. 32-34) are study-characteristics tables listing participants, interventions, and controls, which is a deprioritized figure type and would not increase a reader's confidence in the claim. Recommend supporting the joint Galante/Zeng sentence with the Zeng et al. 2015 forest plot instead.

Systematic reviews and clinical trials indicate that loving-kindness and compassion meditation can increase positive emotion, mindfulness, and life satisfaction while also reducing symptoms of depression and anxiety (Galante et al., 2014; Zeng et al., 2015). / systematic reviews and meta-analyses linking LKM to reduced depression and anxiety and greater life satisfaction.

Two sides of warmth: the wish and the feeling0 figures

No citations in this section of the module text.

Five key principles for learning meditation0 figures

No citations in this section of the module text.

Focus on quality8 figures

Andreu et al., 2022 Table 3
high
Andreu et al., 2022 Table 3
Source caption

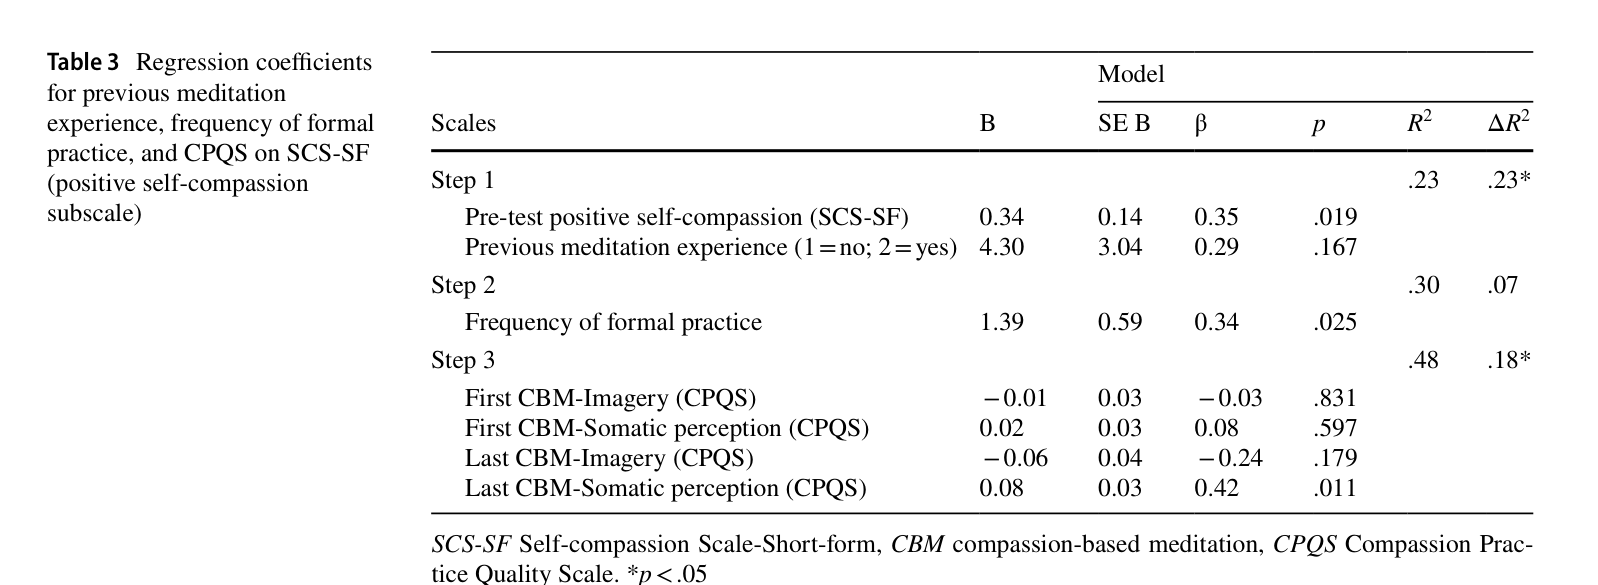
Table 3 Regression coefficients for previous meditation experience, frequency of formal practice, and CPQS on SCS-SF (positive self-compassion subscale) SCS-SF Self-compassion Scale-Short-form, CBM compassion-based meditation, CPQS Compassion Practice Quality Scale. *p < .05

A hierarchical regression that adds predictors in the order a reader would want them: baseline self-compassion and prior meditation experience first, then frequency of formal practice, then compassion practice quality (CPQS). Frequency adds 7% of explained variance and is not flagged significant; practice quality then adds a further 18% (delta R-squared = .18*), driven by somatic perception during the LAST meditation (beta = 0.42, p = .011). The delta R-squared column lets a healthcare professional see the quality-over-frequency point without parsing any coefficient. This is the most directly on-claim table of the three LKM/compassion papers.

The same pattern appears in research on LKM and compassion focused meditation. The ability to evoke and sustain warmth and compassion predicts greater well-being, more positive attitudes toward others, and increased self-compassion. As with research in mindfulness, the benefits of LKM hinged more on measures of quality than on frequency (Zeng et al., 2023; Andreu et al., 2022; Navarrete et al., 2021).
Goldberg et al., 2014 Table 1
high
Goldberg et al., 2014 Table 1
Source caption

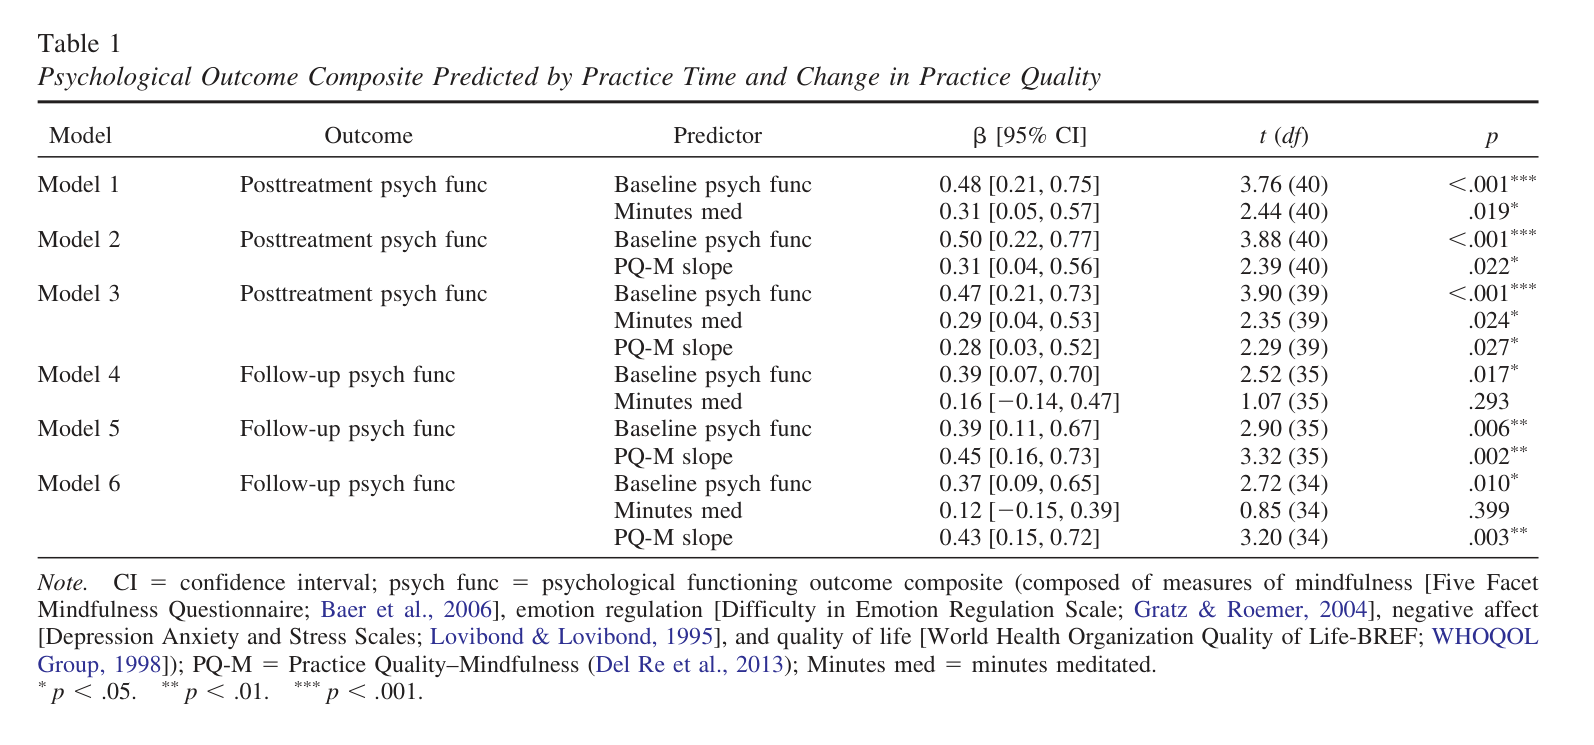
Table 1 Psychological Outcome Composite Predicted by Practice Time and Change in Practice Quality Note. CI = confidence interval; psych func = psychological functioning outcome composite (composed of measures of mindfulness [Five Facet Mindfulness Questionnaire; Baer et al., 2006], emotion regulation [Difficulty in Emotion Regulation Scale; Gratz & Roemer, 2004], negative affect [Depression Anxiety and Stress Scales; Lovibond & Lovibond, 1995], and quality of life [World Health Organization Quality of Life-BREF; WHOQOL Group, 1998]); PQ-M = Practice Quality-Mindfulness (Del Re et al., 2013); Minutes med = minutes meditated. * p < .05. ** p < .01. *** p < .001.

The clearest single piece of evidence in this section. Six models line up 'Minutes med' (practice time) against 'PQ-M slope' (improvement in practice quality) as predictors of psychological functioning. At posttreatment both matter about equally (betas .29 and .28). At 5-month follow-up practice time collapses to a nonsignificant beta = 0.12 [-0.15, 0.39], p = .399, while practice quality holds at beta = 0.43 [0.15, 0.72], p = .003. A clinician can read the two follow-up rows and immediately see that what endures is how you practised, not how long. Effect sizes come with 95% CIs, which reads well for a science-literate audience.

In these studies, higher-quality practice is defined as repeatedly returning to present-focused attention with an accepting, nonresistant attitude. This quality of engagement predicts better psychological outcomes more strongly than the amount of time spent meditating (Del Re et al., 2013; Goldberg et al., 2014).
Del Re et al., 2013 Figure 1
medium
Del Re et al., 2013 Figure 1
Source caption

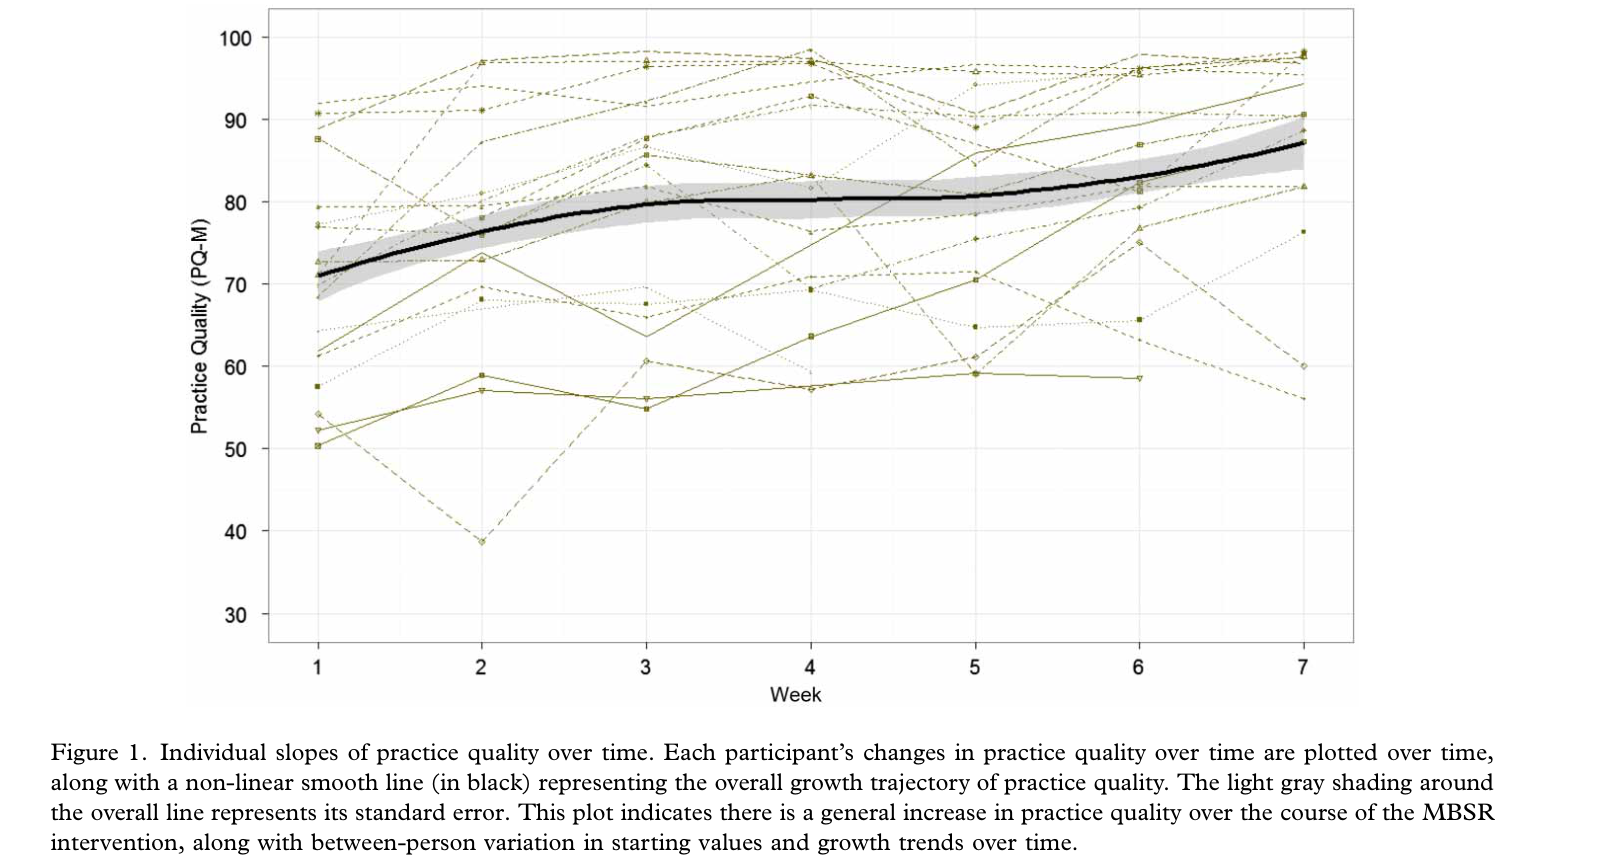
Figure 1. Individual slopes of practice quality over time. Each participant's changes in practice quality over time are plotted over time, along with a non-linear smooth line (in black) representing the overall growth trajectory of practice quality. The light gray shading around the overall line represents its standard error. This plot indicates there is a general increase in practice quality over the course of the MBSR intervention, along with between-person variation in starting values and growth trends over time.

Spaghetti plot of every MBSR participant's weekly PQ-M (Practice Quality-Mindfulness) score across the 7-week course, with the average growth trajectory in bold. It makes 'practice quality' concrete and visibly measurable: the group average climbs about 2 points per week, but individual lines fan out wildly, so two people doing the same course can be practising very differently. It is the single most readable graphic in this whole citation cluster. Honest caveat: it plots quality over time, not quality against outcome, so it supports the premise of the sentence rather than the quality-beats-quantity comparison itself.

In these studies, higher-quality practice is defined as repeatedly returning to present-focused attention with an accepting, nonresistant attitude. This quality of engagement predicts better psychological outcomes more strongly than the amount of time spent meditating (Del Re et al., 2013; Goldberg et al., 2014).
Del Re et al., 2013 Table IVb
medium
Del Re et al., 2013 Table IVb
Source caption

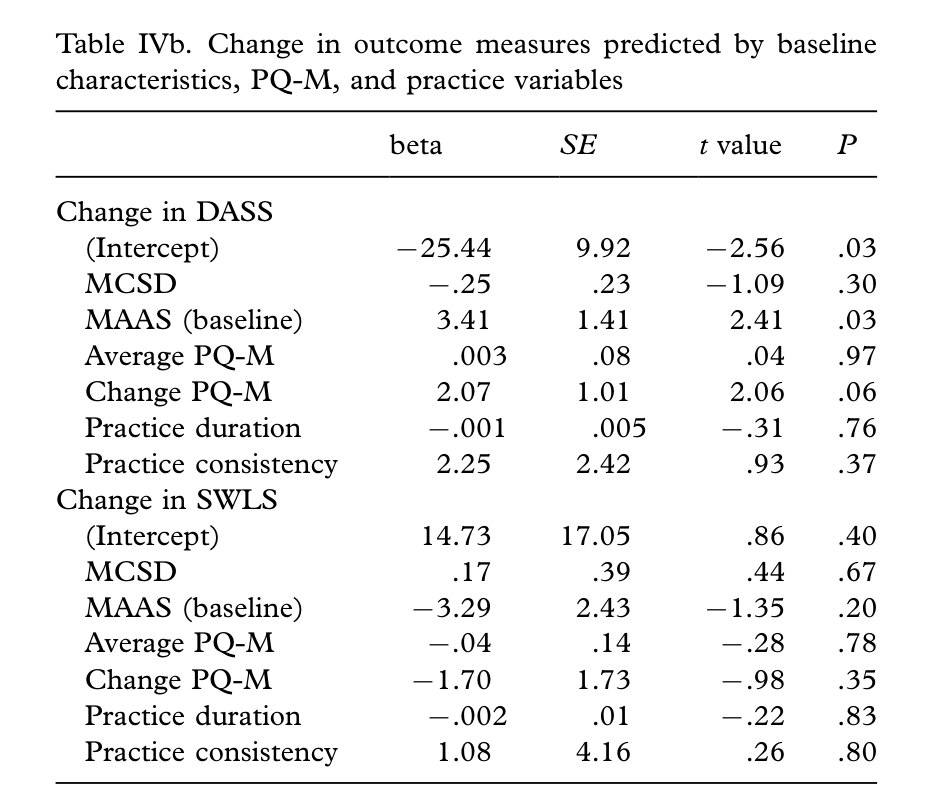
Table IVb. Change in outcome measures predicted by baseline characteristics, PQ-M, and practice variables

This is the regression in which practice quality and practice quantity go head to head in the same model. For change in depression/anxiety/stress (DASS), Change PQ-M carries the effect (beta = 2.07, p = .06) while Practice duration (p = .76) and Practice consistency (p = .37) contribute essentially nothing. That is exactly the quality-over-quantity comparison the module sentence attributes to Del Re et al. Caveat: it is a plain coefficient table, the key p-value is .06 rather than conventionally significant, and the second block (life satisfaction, SWLS) is null throughout, so it should be presented with that nuance rather than as a clean win.

In these studies, higher-quality practice is defined as repeatedly returning to present-focused attention with an accepting, nonresistant attitude. This quality of engagement predicts better psychological outcomes more strongly than the amount of time spent meditating (Del Re et al., 2013; Goldberg et al., 2014).
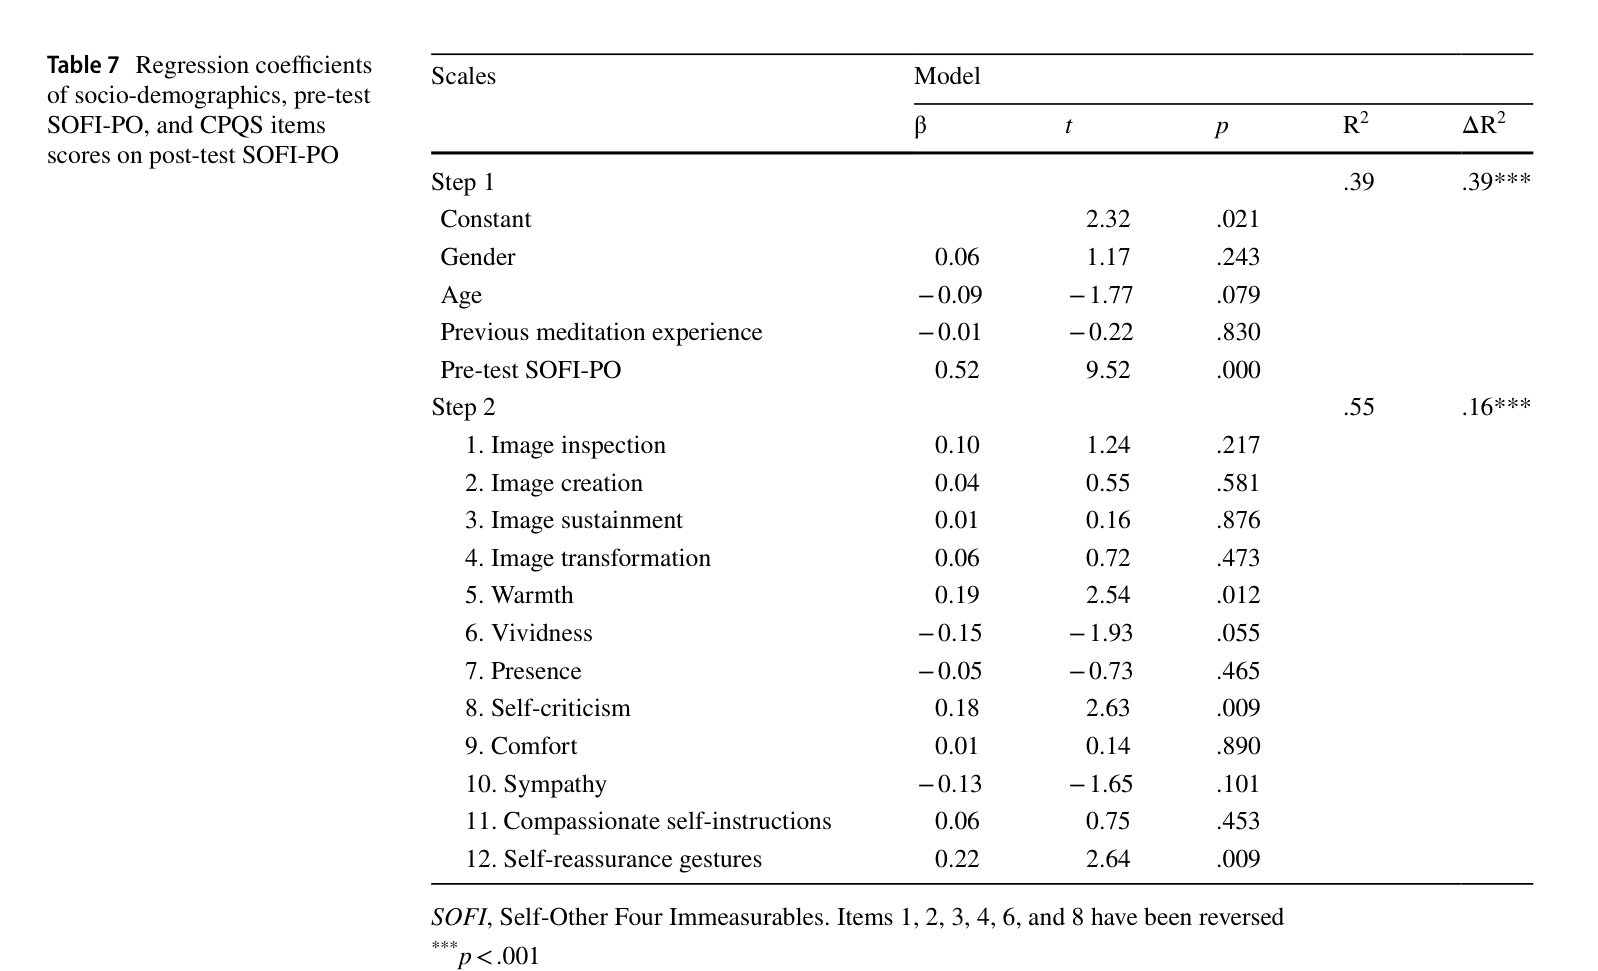
Navarrete et al., 2021 Table 7
medium
Navarrete et al., 2021 Table 7
Source caption

Table 7 Regression coefficients of socio-demographics, pre-test SOFI-PO, and CPQS items scores on post-test SOFI-PO SOFI, Self-Other Four Immeasurables. Items 1, 2, 3, 4, 6, and 8 have been reversed *** p < .001

Supports the 'warmth' half of the module sentence unusually literally, because the practice-quality scale is broken out item by item and the items are named in plain English. Predicting post-session positive qualities toward others, prior meditation experience does nothing (beta = -0.01, p = .830), while the quality items add 16% of variance, with Warmth (beta = 0.19, p = .012), Self-criticism (0.18, p = .009) and Self-reassurance gestures (0.22, p = .009) carrying it, and the four mental-imagery items all null. The takeaway a nurse or physician would draw - felt warmth matters, vividness of visual imagery does not - is genuinely useful. Caveat: 17 rows is a dense table and the reversed scoring of some items needs a note.

The same pattern appears in research on LKM and compassion focused meditation. The ability to evoke and sustain warmth and compassion predicts greater well-being, more positive attitudes toward others, and increased self-compassion. As with research in mindfulness, the benefits of LKM hinged more on measures of quality than on frequency (Zeng et al., 2023; Andreu et al., 2022; Navarrete et al., 2021).
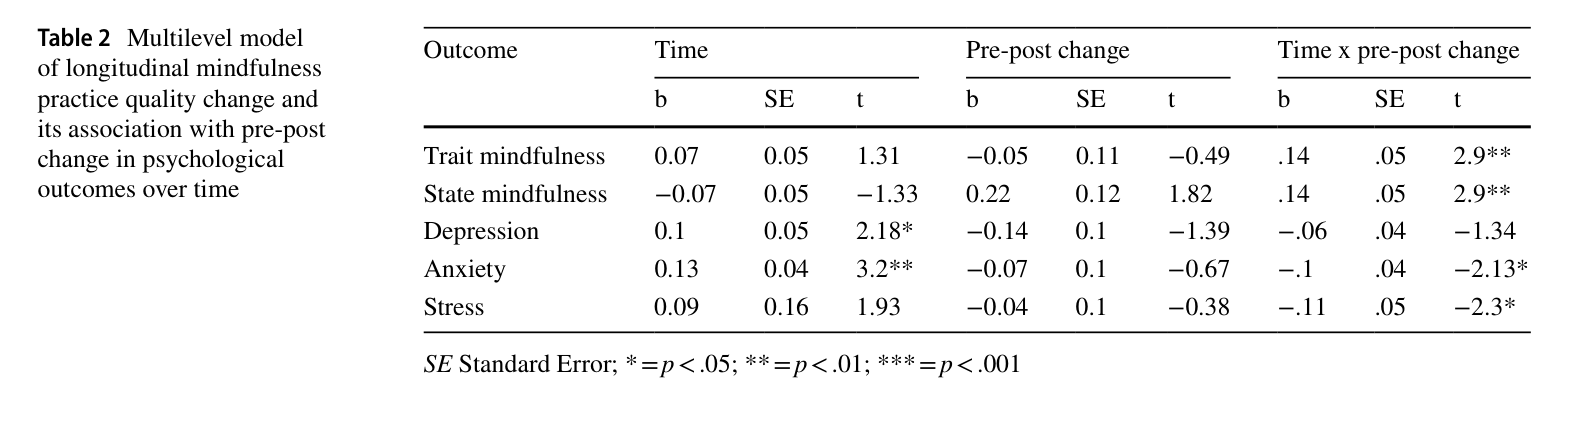
Strohmaier & Goldberg, 2024 Table 2
medium
Strohmaier & Goldberg, 2024 Table 2
Source caption

Table 2 Multilevel model of longitudinal mindfulness practice quality change and its association with pre-post change in psychological outcomes over time SE Standard Error; * = p < .05; ** = p < .01; *** = p < .001

The 'Time x pre-post change' column is the directional result the module sentence rests on: participants whose trait and state mindfulness improved most also showed the steepest rise in practice quality (b = .14, t = 2.9, p < .01 for both), and those with the largest drops in anxiety (t = -2.13) and stress (t = -2.3) likewise. Crucially, the authors report on the facing page that the mirror-image models - pre-post change in practice quality predicting later change in symptoms - showed no such interactions, which is what licenses the 'quality comes first' reading. That asymmetry is the actual evidence and it is NOT visible in the table, so the caption or surrounding module text must supply it. There is no cross-lagged path diagram anywhere in this paper; this table is the closest thing available.

Recent research suggests that improvements in practice quality tend to come before the benefits, including improvements in mindfulness and reductions in anxiety and stress (Strohmaier & Goldberg, 2024).
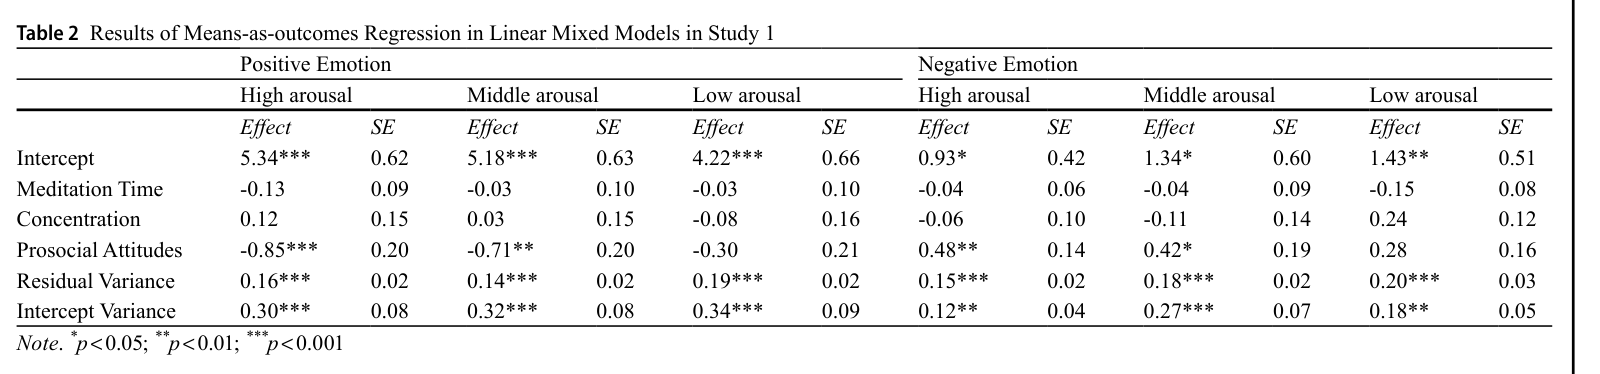
Zeng et al., 2023 Table 2
medium
Zeng et al., 2023 Table 2
Source caption

Table 2 Results of Means-as-outcomes Regression in Linear Mixed Models in Study 1 Note. *p<0.05; **p<0.01; ***p<0.001

This is the direct quantity-versus-quality contrast for loving-kindness meditation, and it is the cleanest one in the LKM papers. Reading down the rows: 'Meditation Time' is nonsignificant for all six emotion outcomes, while 'Prosocial Attitudes' (difficulty generating warmth toward others - a quality measure, scored so that higher = more difficulty) predicts less high- and middle-arousal positive emotion (-0.85***, -0.71**) and more negative emotion (0.48**, 0.42*). Two caveats for the course authors: the quality items are reverse-scored so the negative signs mean 'more difficulty, worse outcome', which needs a sentence of explanation; and six outcome columns is a lot to take in at a glance.

The same pattern appears in research on LKM and compassion focused meditation. The ability to evoke and sustain warmth and compassion predicts greater well-being, more positive attitudes toward others, and increased self-compassion. As with research in mindfulness, the benefits of LKM hinged more on measures of quality than on frequency (Zeng et al., 2023; Andreu et al., 2022; Navarrete et al., 2021).
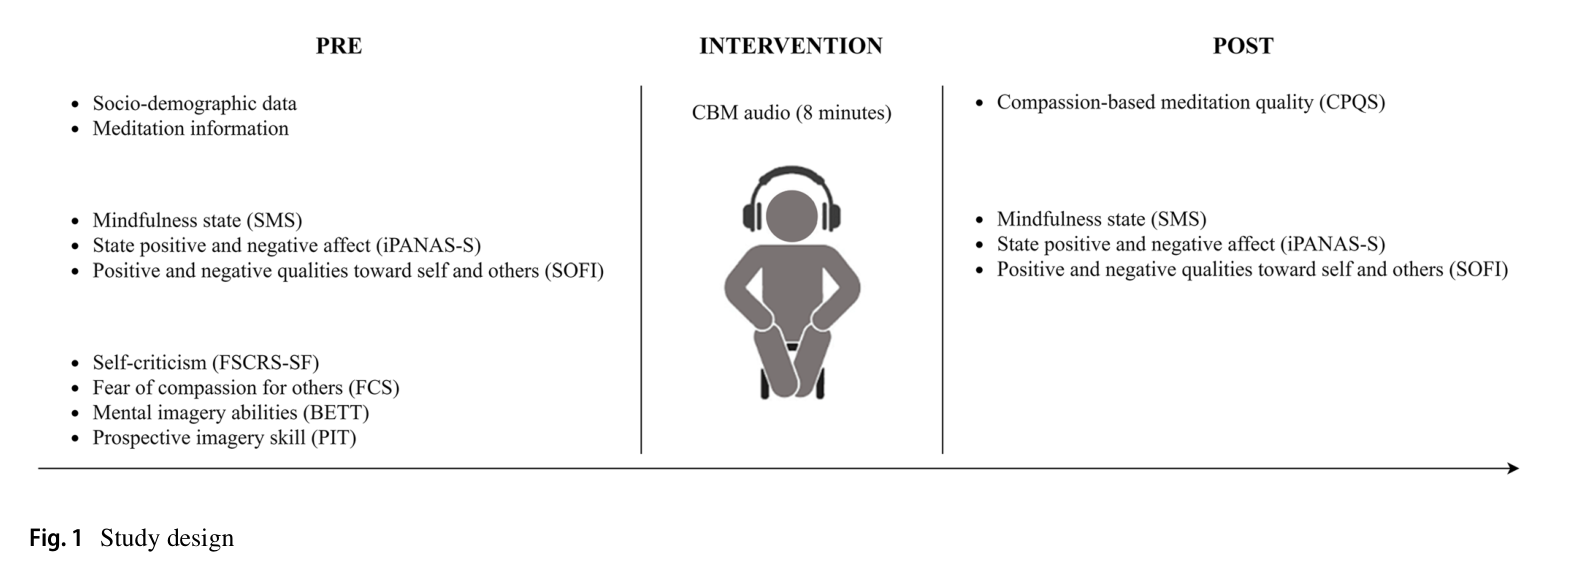
Navarrete et al., 2021 Fig. 1
low
Navarrete et al., 2021 Fig. 1
Source caption

Fig. 1 Study design

A clean pre / intervention / post timeline showing that the whole study rests on a single 8-minute audio-guided compassion meditation, with practice quality (CPQS) rated immediately afterwards. It is the only actual figure in any of the three LKM/compassion papers and it renders very well. Include it only if the module wants to show readers how small a dose these quality studies used - it says nothing about the quality-versus-frequency claim itself, so it is a context graphic rather than evidence.

The same pattern appears in research on LKM and compassion focused meditation. The ability to evoke and sustain warmth and compassion predicts greater well-being, more positive attitudes toward others, and increased self-compassion. As with research in mindfulness, the benefits of LKM hinged more on measures of quality than on frequency (Zeng et al., 2023; Andreu et al., 2022; Navarrete et al., 2021).
Goldberg et al., 2020
none
No figure

This paper genuinely contains no in-text figures or tables in either available copy. I identified 'Does_practice_quality_mediate_.pdf' as the published journal version of exactly this paper (Goldberg, Knoeppel, Davidson & Flook, 'Does practice quality mediate the relationship between practice time and outcome in mindfulness-based stress reduction?', J Couns Psychol 2020), and 'Goldberg et al 2020.pdf' as the PMC author manuscript of the same article. I rendered and read pages across both and checked embedded-image and vector-path counts page by page: apart from the journal logo on page 1, every page is body text only. The reason is stated in the article itself - the mediation figure is 'Figure S1 in the online supplemental materials' and every model table is Table S1-S7 in the supplement, none of which is bundled in these PDFs. The ideal figure for this claim (the mediation path: practice time -> practice quality -> mindfulness, ACME beta = .14 [.06, .24], p < .001) would have to be redrawn by the course authors from the text on PDF p5 of the published version rather than reproduced.

In mindfulness-based interventions, this improvement in quality helps explain why greater practice time leads to better outcomes (Goldberg et al., 2020).

Recipe over review4 figures

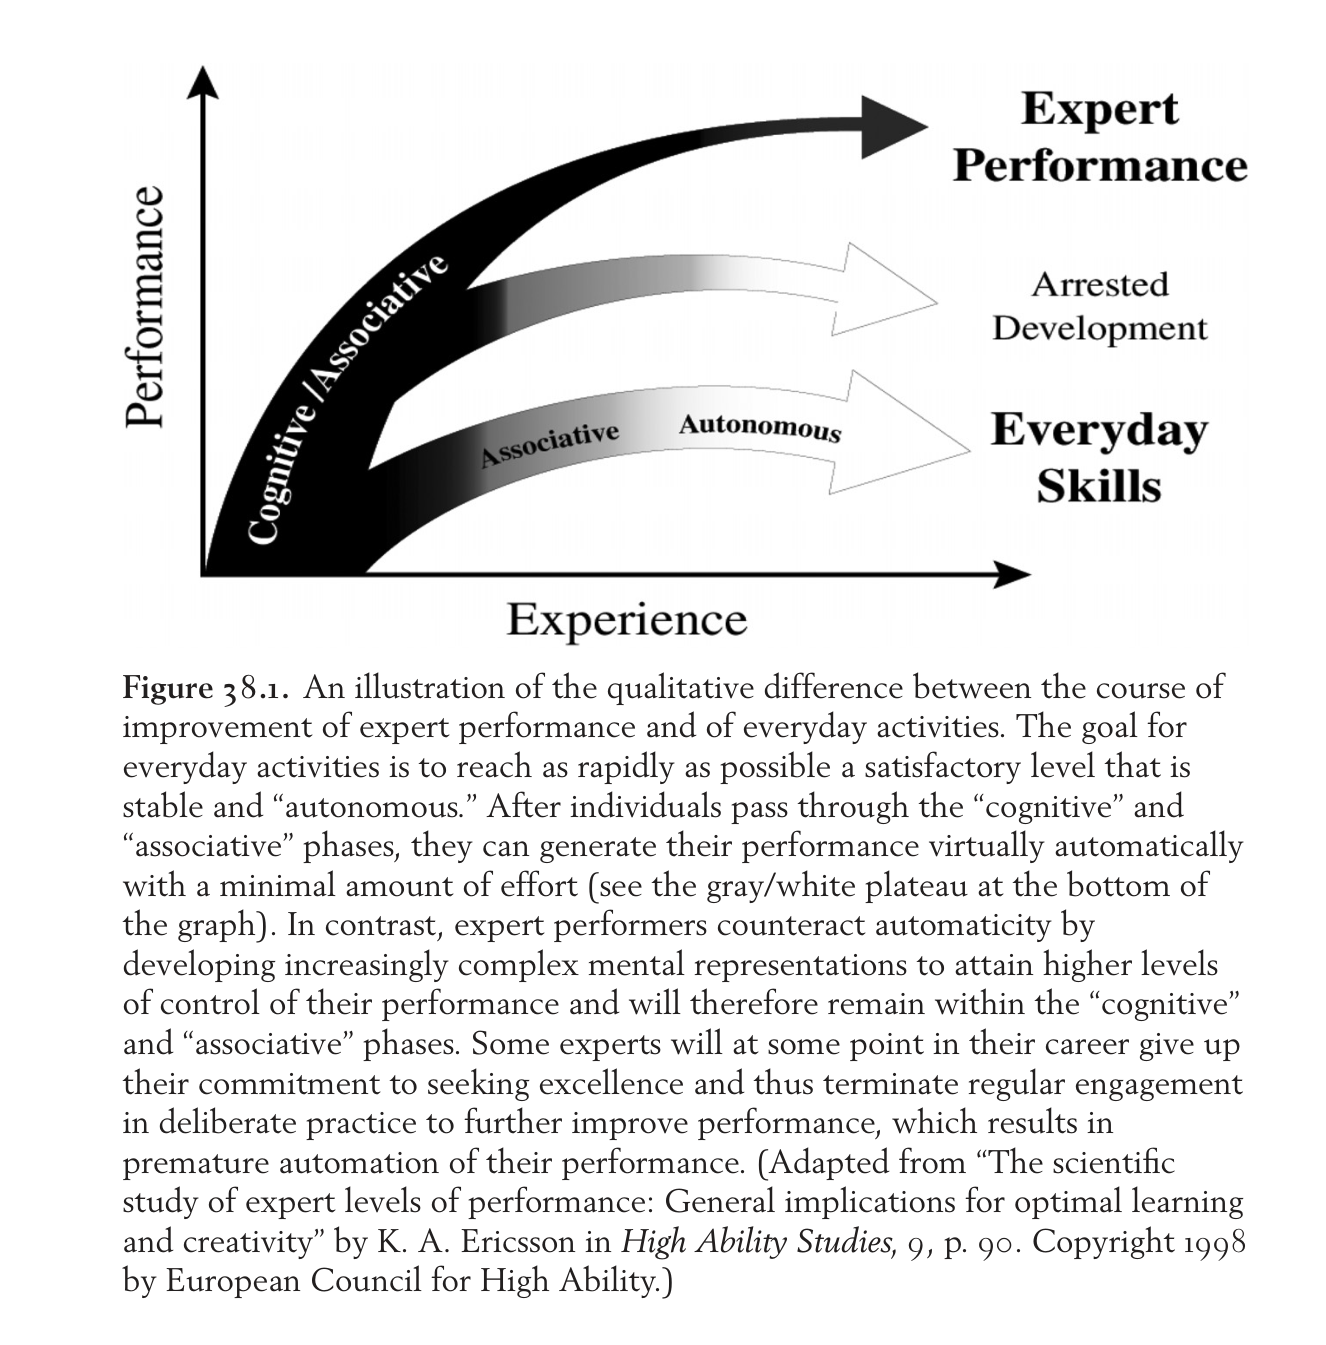
Ericsson, 2006 Figure 38.1
high
Ericsson, 2006 Figure 38.1
Source caption

Figure 38.1. An illustration of the qualitative difference between the course of improvement of expert performance and of everyday activities. The goal for everyday activities is to reach as rapidly as possible a satisfactory level that is stable and “autonomous.” After individuals pass through the “cognitive” and “associative” phases, they can generate their performance virtually automatically with a minimal amount of effort (see the gray/white plateau at the bottom of the graph). In contrast, expert performers counteract automaticity by developing increasingly complex mental representations to attain higher levels of control of their performance and will therefore remain within the “cognitive” and “associative” phases. Some experts will at some point in their career give up their commitment to seeking excellence and thus terminate regular engagement in deliberate practice to further improve performance, which results in premature automation of their performance. (Adapted from “The scientific study of expert levels of performance: General implications for optimal learning and creativity” by K. A. Ericsson in High Ability Studies, 9, p. 90. Copyright 1998 by European Council for High Ability.)

Three diverging arrows on a performance-vs-experience plot: 'Expert Performance' keeps climbing, while 'Arrested Development' and 'Everyday Skills' flatten out once the activity becomes automatic. This is the single clearest visual statement of the module's core claim that accumulating experience is not the same as improving, and that skill keeps developing only when the practitioner deliberately stays in the effortful 'cognitive/associative' mode rather than coasting. A nurse or physician will recognise the arrested-development arrow immediately as the career pattern the module is warning against, and it reads in well under 20 seconds.

learning requires breaking the practice into concrete skills and refining them over time (Ericsson, 2006; Ericsson & Pool, 2016).
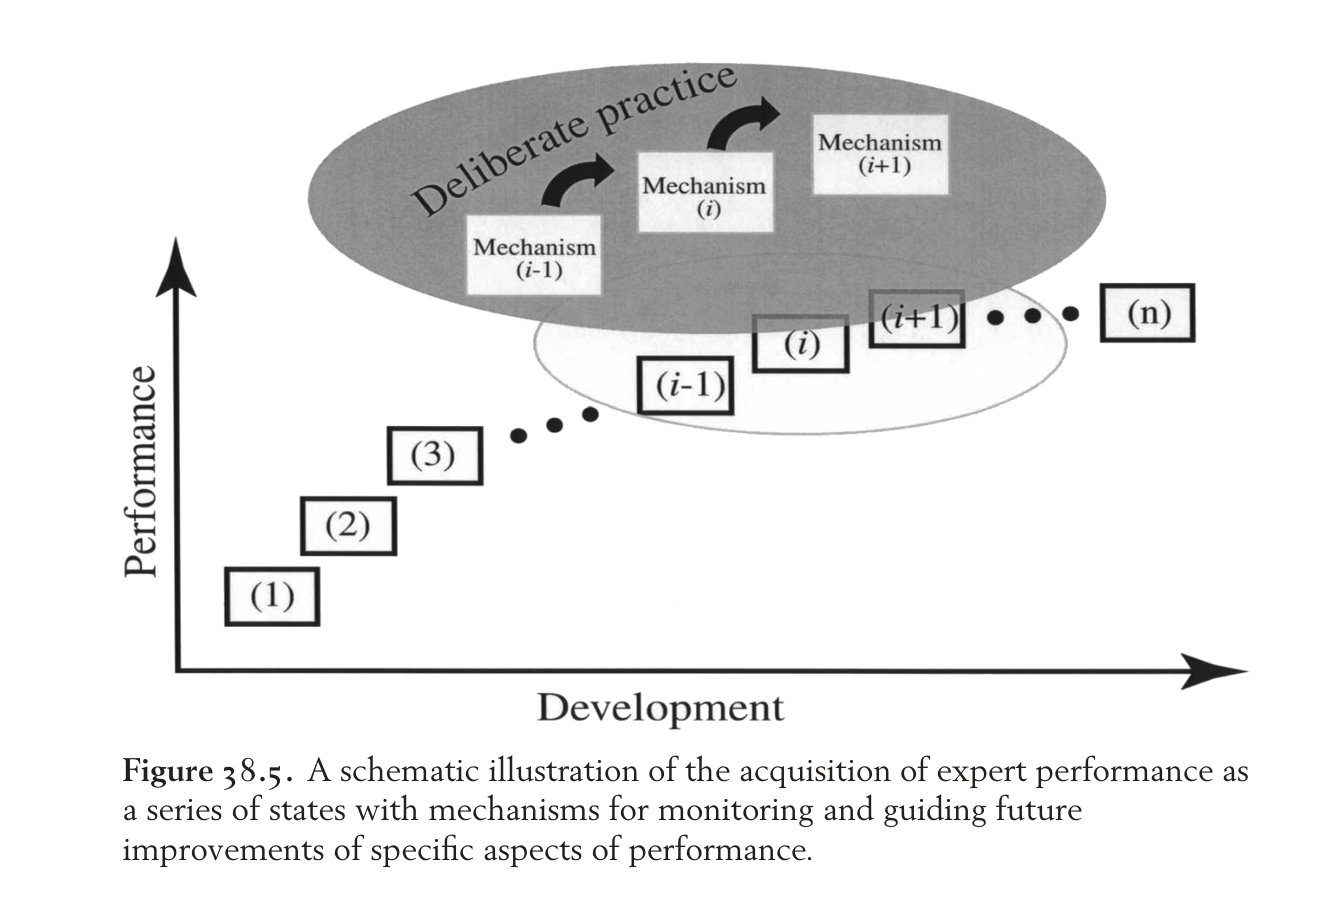
Ericsson, 2006 Figure 38.5
high
Ericsson, 2006 Figure 38.5
Source caption

Figure 38.5. A schematic illustration of the acquisition of expert performance as a series of states with mechanisms for monitoring and guiding future improvements of specific aspects of performance.

A staircase of discrete performance states (1), (2), (3) ... (n), with a magnified inset showing deliberate practice moving the learner from Mechanism (i-1) to Mechanism (i) to Mechanism (i+1). This is the closest thing in the literature to a picture of the module's actual sentence: expertise is built by breaking practice into concrete sub-skills and refining them one at a time. It gives the reader a mental model for why a 'recipe' of specific steps beats an undifferentiated review of the whole practice.

learning requires breaking the practice into concrete skills and refining them over time (Ericsson, 2006; Ericsson & Pool, 2016).
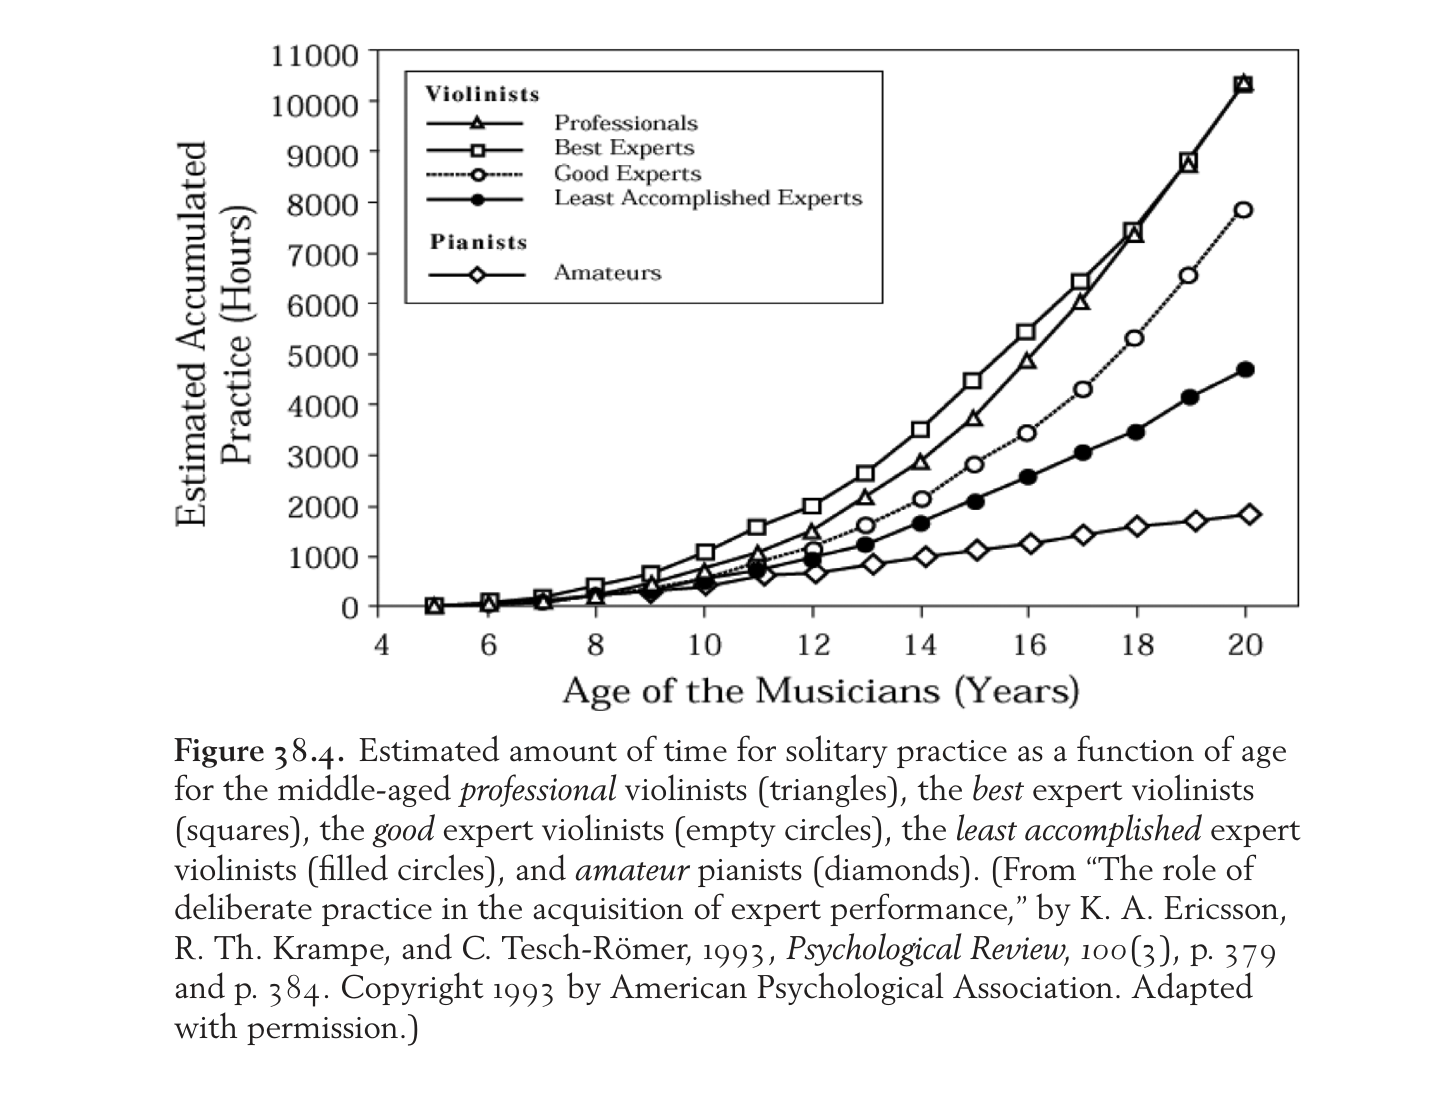
Ericsson, 2006 Figure 38.4
high
Ericsson, 2006 Figure 38.4
Source caption

Figure 38.4. Estimated amount of time for solitary practice as a function of age for the middle-aged professional violinists (triangles), the best expert violinists (squares), the good expert violinists (empty circles), the least accomplished expert violinists (filled circles), and amateur pianists (diamonds). (From “The role of deliberate practice in the acquisition of expert performance,” by K. A. Ericsson, R. Th. Krampe, and C. Tesch-Römer, 1993, Psychological Review, 100(3), p. 379 and p. 384. Copyright 1993 by American Psychological Association. Adapted with permission.)

The famous accumulated-practice-hours curves for violinists, cleanly separated by attainment level, with amateur pianists flat at the bottom. It is the empirical backbone of the whole deliberate-practice literature and the origin of the '10,000 hours' idea the module's audience will already have heard of. Its value here is that the groups differ in accumulated deliberate practice, not in total years of exposure — which is the distinction the section is drawing. Note it is about musicians, so it supports the general principle rather than anything about meditation specifically.

learning requires breaking the practice into concrete skills and refining them over time (Ericsson, 2006; Ericsson & Pool, 2016).
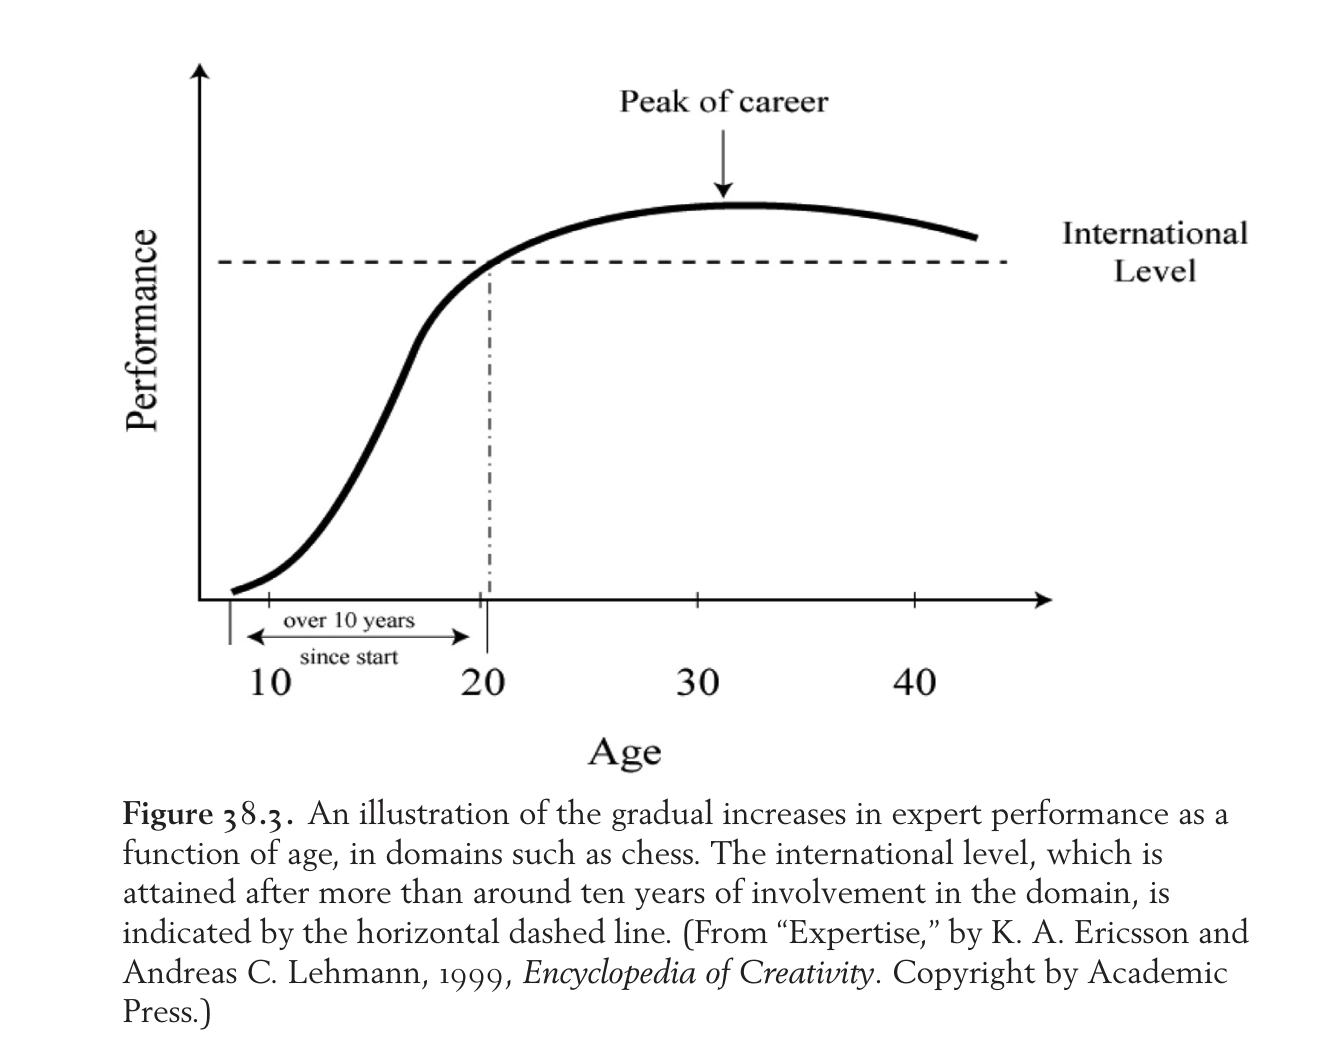
Ericsson, 2006 Figure 38.3
medium
Ericsson, 2006 Figure 38.3
Source caption

Figure 38.3. An illustration of the gradual increases in expert performance as a function of age, in domains such as chess. The international level, which is attained after more than around ten years of involvement in the domain, is indicated by the horizontal dashed line. (From “Expertise,” by K. A. Ericsson and Andreas C. Lehmann, 1999, Encyclopedia of Creativity. Copyright by Academic Press.)

A single smooth curve of performance against age showing that international-level attainment arrives only after more than ten years of involvement, with a 'peak of career' marker. It makes the timescale argument concrete — improvement is gradual and long — which supports the 'over time' half of the module sentence. It is the weakest of the four Ericsson figures for this section because it says nothing about the structure of practice, only its duration; include it only if the section wants to make a point about patience and horizon.

learning requires breaking the practice into concrete skills and refining them over time (Ericsson, 2006; Ericsson & Pool, 2016).
Ericsson & Pool, 2016
none
No figure

The available copy of Peak is an EPUB trade-book edition, not a PDF. Its archive contains only four images: cover.jpeg, a typeset title page (images/00001.jpeg), and author headshots of Anders Ericsson and Robert Pool (images/00002.jpeg, images/00003.jpeg). There are no charts, diagrams, or data figures anywhere in the file, and the format has no stable page numbers for a reader link. Use the Ericsson (2006) chapter figures to carry this claim visually.

learning requires breaking the practice into concrete skills and refining them over time (Ericsson, 2006; Ericsson & Pool, 2016).

Playful experimentation3 figures

Whitton, 2022 Fig. 2
high
Whitton, 2022 Fig. 2
Source caption

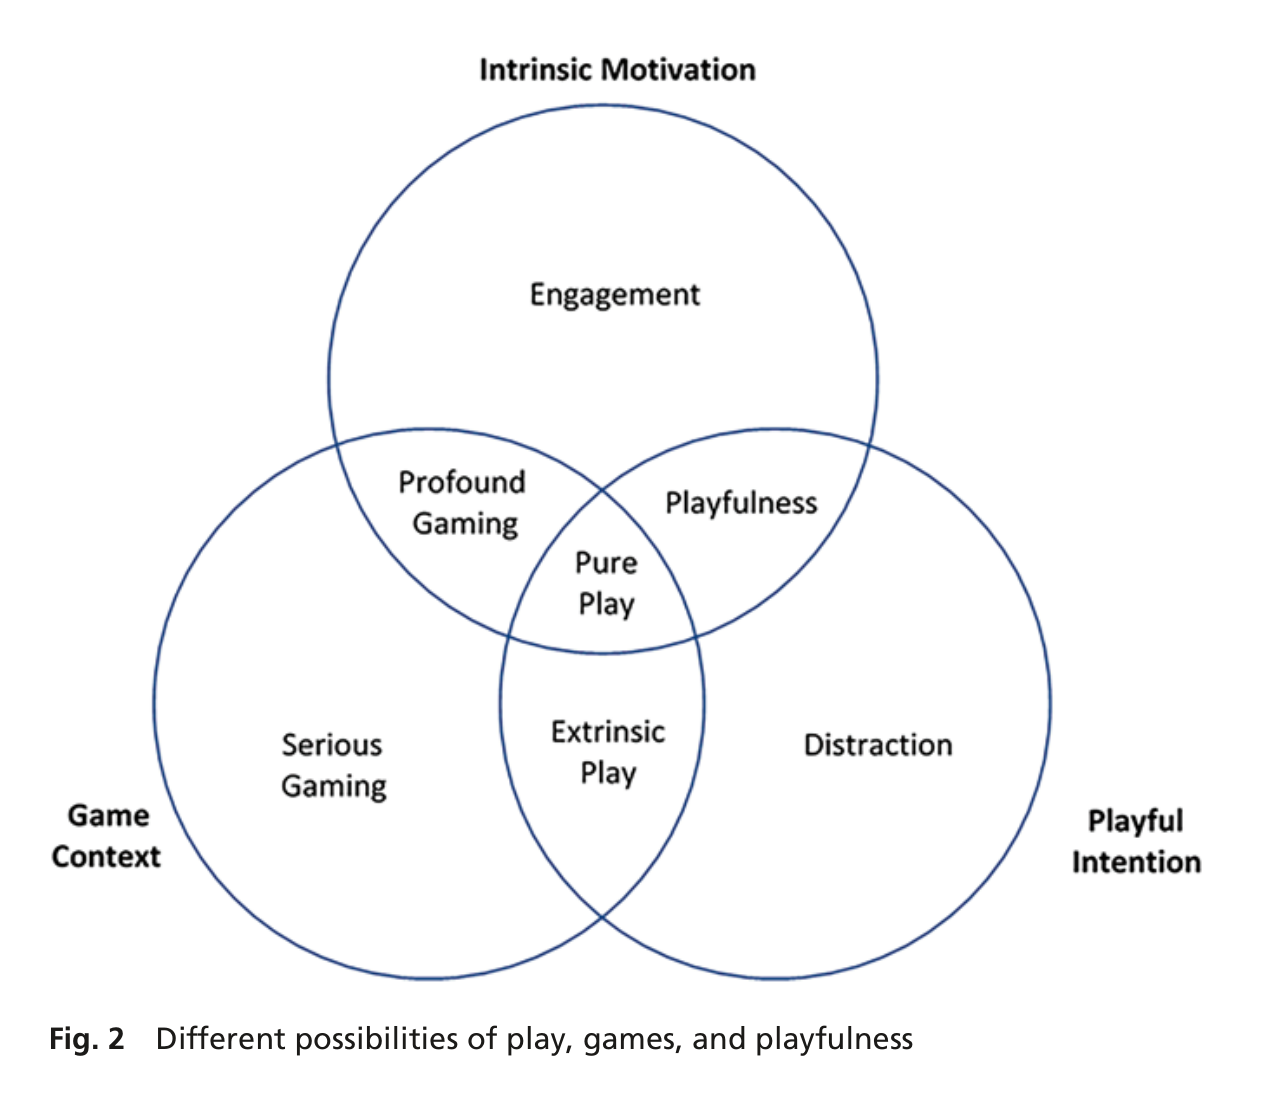
Fig. 2 Different possibilities of play, games, and playfulness

A three-circle Venn whose axes are Intrinsic Motivation, Playful Intention, and Game Context; only the centre — where all three overlap — counts as 'Pure Play', while activities missing intrinsic motivation fall out as 'Extrinsic Play', 'Serious Gaming' or 'Distraction'. It draws exactly the boundary the module sentence draws, that play must be voluntary and intrinsically motivated to be play at all, and it pairs naturally with Gray's definition in the same passage. Instantly legible with no specialist vocabulary.

research suggests that voluntary, intrinsically motivated play can foster increased creativity, resilience, and adaptability (Whitton, 2022; Diaz-Varela & Wright, 2019). Consistent with this view, the psychologist Peter Gray (2017) defines play as an activity that is self-chosen, imaginative, and focused more on process than outcome.
Whitton, 2022 Fig. 2
high
Whitton, 2022 Fig. 2
Source caption

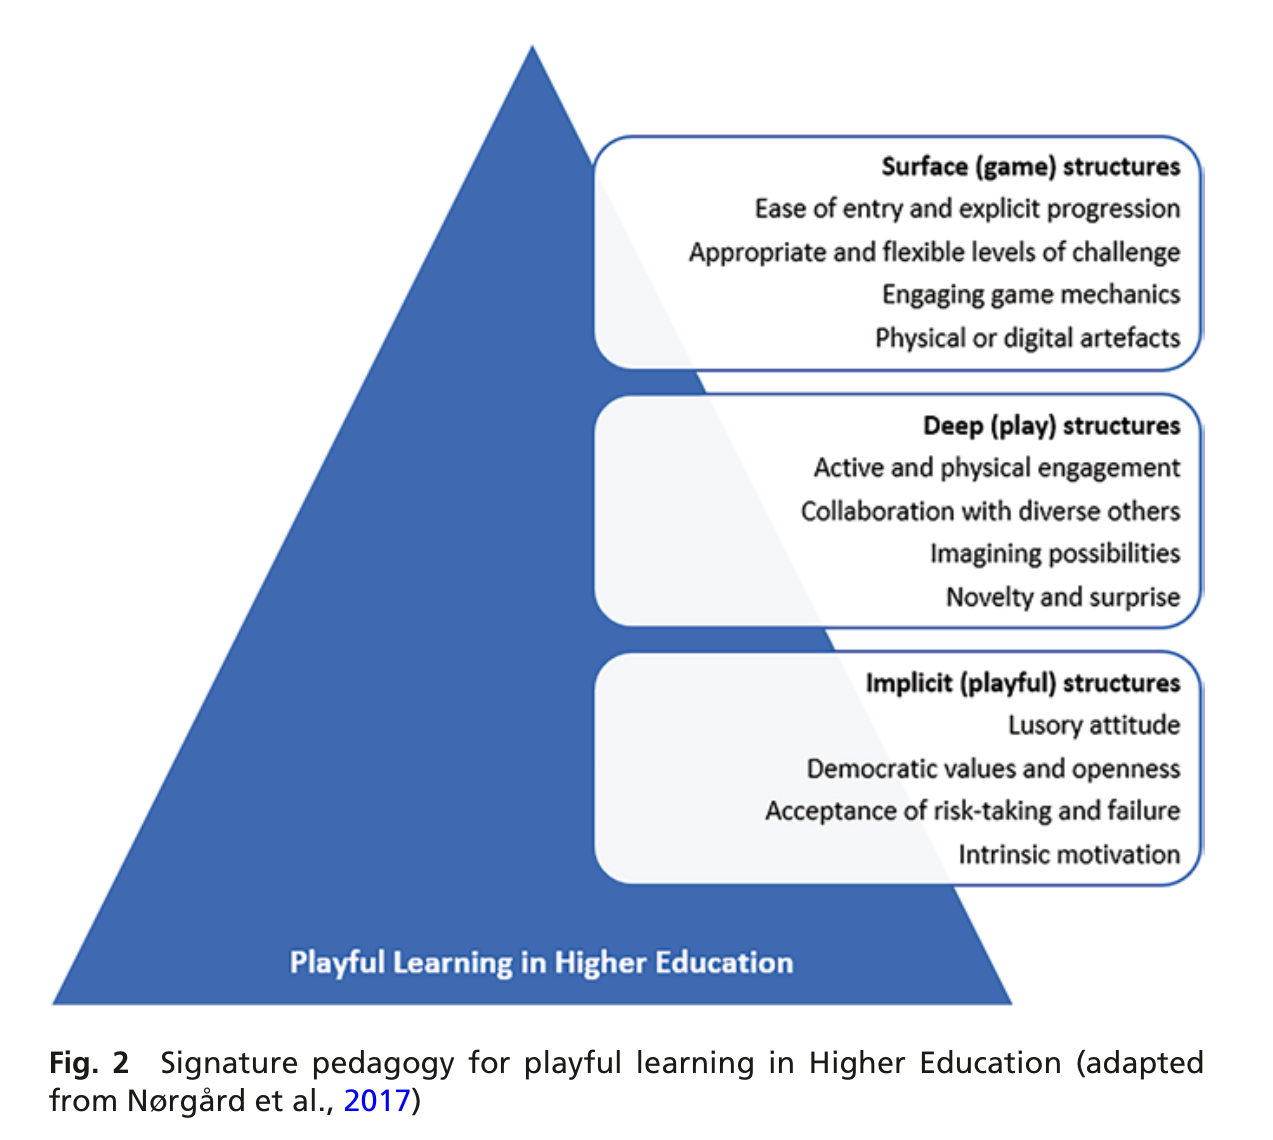
Fig. 2 Signature pedagogy for playful learning in Higher Education (adapted from Nørgård et al., 2017)

A three-tier pyramid setting out what playful learning consists of: surface (game) structures, deep (play) structures, and implicit (playful) structures. The bottom tier lists 'intrinsic motivation' and 'acceptance of risk-taking and failure', and the middle tier lists 'imagining possibilities' and 'novelty and surprise' — i.e. the mechanisms by which the module claims play produces creativity, resilience, and adaptability. It gives a course reader a compact vocabulary for what a playful attitude toward one's own meditation practice would actually involve. Note the framework is written for higher-education teaching, not clinical practice, so it transfers by analogy.

research suggests that voluntary, intrinsically motivated play can foster increased creativity, resilience, and adaptability (Whitton, 2022; Diaz-Varela & Wright, 2019). Consistent with this view, the psychologist Peter Gray (2017) defines play as an activity that is self-chosen, imaginative, and focused more on process than outcome.
Whitton, 2022 Fig. 4
medium
Whitton, 2022 Fig. 4
Source caption

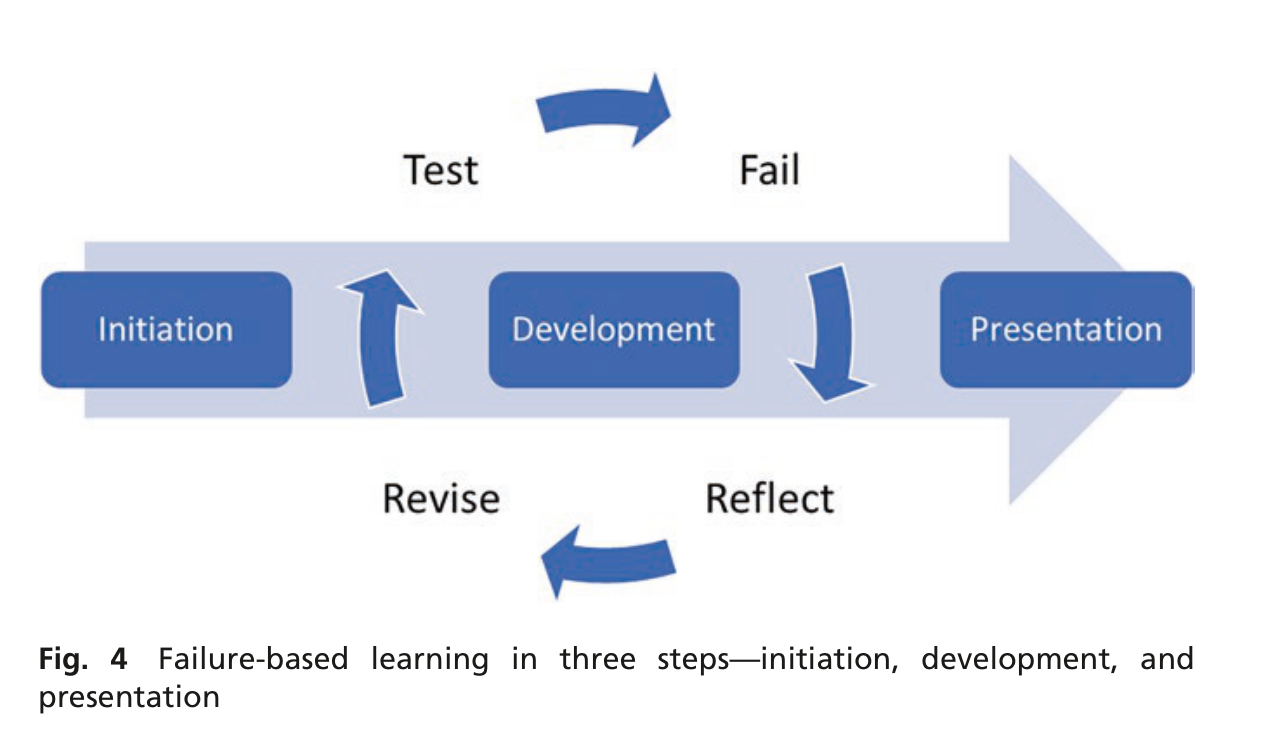
Fig. 4 Failure-based learning in three steps—initiation, development, and presentation

A simple left-to-right cycle — Initiation, Development, Presentation — with an inner Test / Fail / Reflect / Revise loop, drawn from Whitton's escape-room design work. It illustrates the resilience half of the claim concretely: playful contexts make failure cheap and iterative rather than threatening, which is a useful frame for a beginner whose meditation sessions keep 'going badly'. It is only loosely related to the module's subject matter — the source context is game design in higher education, not contemplative practice — so it earns a place as an analogy rather than as evidence.

research suggests that voluntary, intrinsically motivated play can foster increased creativity, resilience, and adaptability (Whitton, 2022; Diaz-Varela & Wright, 2019). Consistent with this view, the psychologist Peter Gray (2017) defines play as an activity that is self-chosen, imaginative, and focused more on process than outcome.
Diaz-Varela & Wright, 2019
none
No figure

All six pages were rendered and inspected. The file is a five-page narrative case study of Right To Play's Continuum of Teacher Training with a University of Edinburgh repository cover sheet at the front; pages 2–5 are unbroken single-column prose under plain section headings and page 6 is references. There are no figures, tables, boxes, or diagrams anywhere — the only embedded images in the PDF are the university crest and the Open Access logo on the cover sheet. Nothing here is reproducible as a course figure.

research suggests that voluntary, intrinsically motivated play can foster increased creativity, resilience, and adaptability (Whitton, 2022; Diaz-Varela & Wright, 2019). Consistent with this view, the psychologist Peter Gray (2017) defines play as an activity that is self-chosen, imaginative, and focused more on process than outcome.
Gray, 2017
none
No figure

The article contains no figures, tables, or boxed lists at all — the caption scan returned zero hits and zero embedded images across all twelve pages, and the pages carrying the definition were rendered and confirmed to be plain two-column prose. The four defining characteristics the module quotes are stated inline on page 4 ('play is (1) self-chosen and self-directed, (2) intrinsically motivated, (3) guided by mental rules that leave room for creativity, and (4) imaginative'), each then elaborated under its own running heading. If the module wants the boxed list of play's characteristics that this section would benefit from, it will have to be typeset by the course authors from that sentence rather than reproduced.

research suggests that voluntary, intrinsically motivated play can foster increased creativity, resilience, and adaptability (Whitton, 2022; Diaz-Varela & Wright, 2019). Consistent with this view, the psychologist Peter Gray (2017) defines play as an activity that is self-chosen, imaginative, and focused more on process than outcome.

Sensitivity to “near enemies”0 figures

No citations in this section of the module text.

Staying connected to aspiration5 figures

Goel et al., 2018 Table 4
high
Goel et al., 2018 Table 4
Source caption

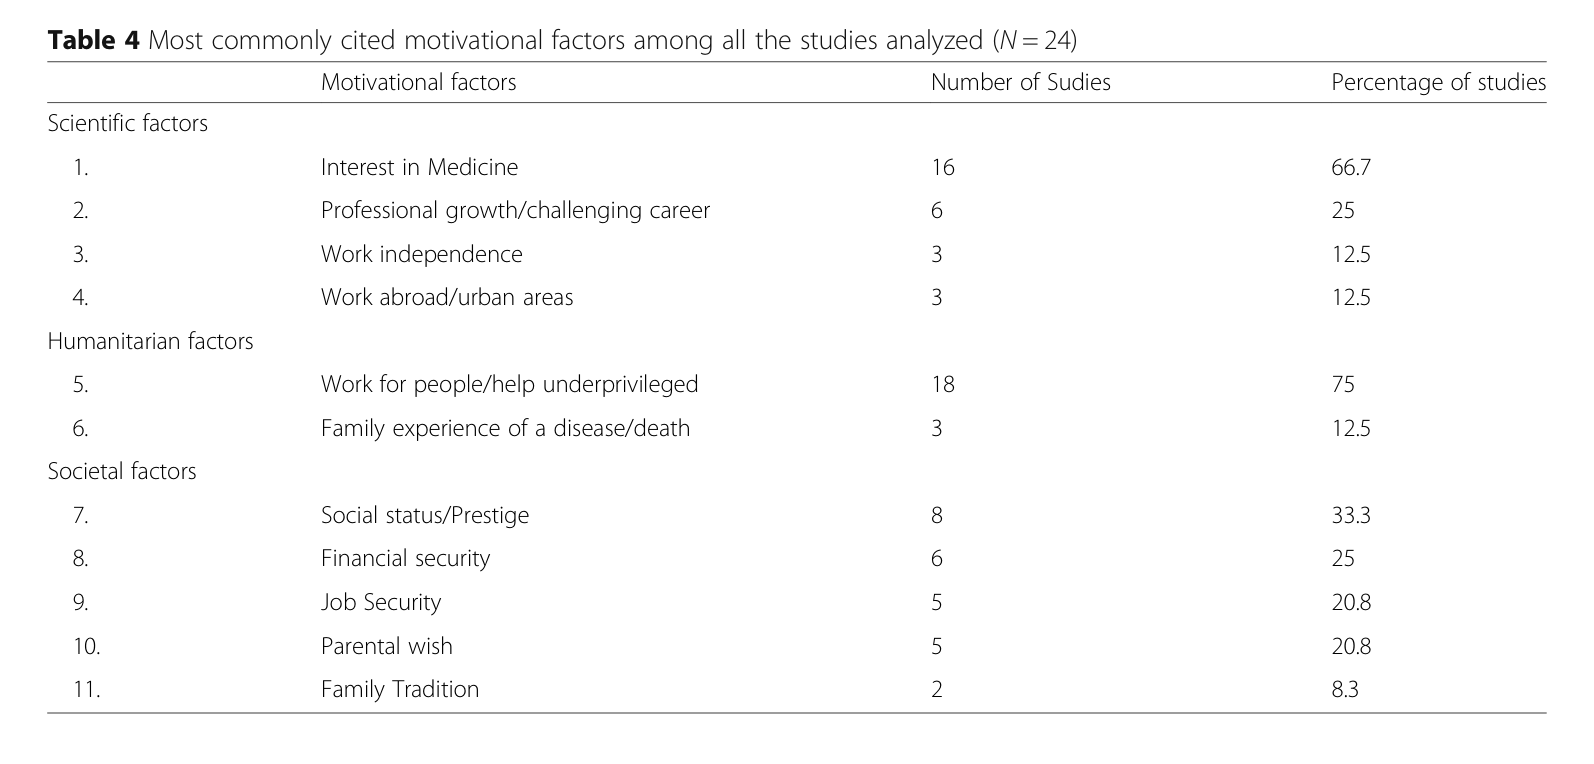
Table 4 Most commonly cited motivational factors among all the studies analyzed (N = 24)

Ranks the eleven motivational factors reported across 24 studies of medical students worldwide, grouped as scientific, humanitarian, and societal. 'Work for people/help underprivileged' is the single most frequently cited factor in the whole review at 75% of studies, ahead of interest in medicine (66.7%) and far ahead of social status (33.3%) and financial security (25%). For an audience of practising clinicians this is the most direct and most personally resonant evidence in the batch for the module's claim — it puts a number on the wish to help others being the modal reason people enter the profession. Compact and legible at a glance.

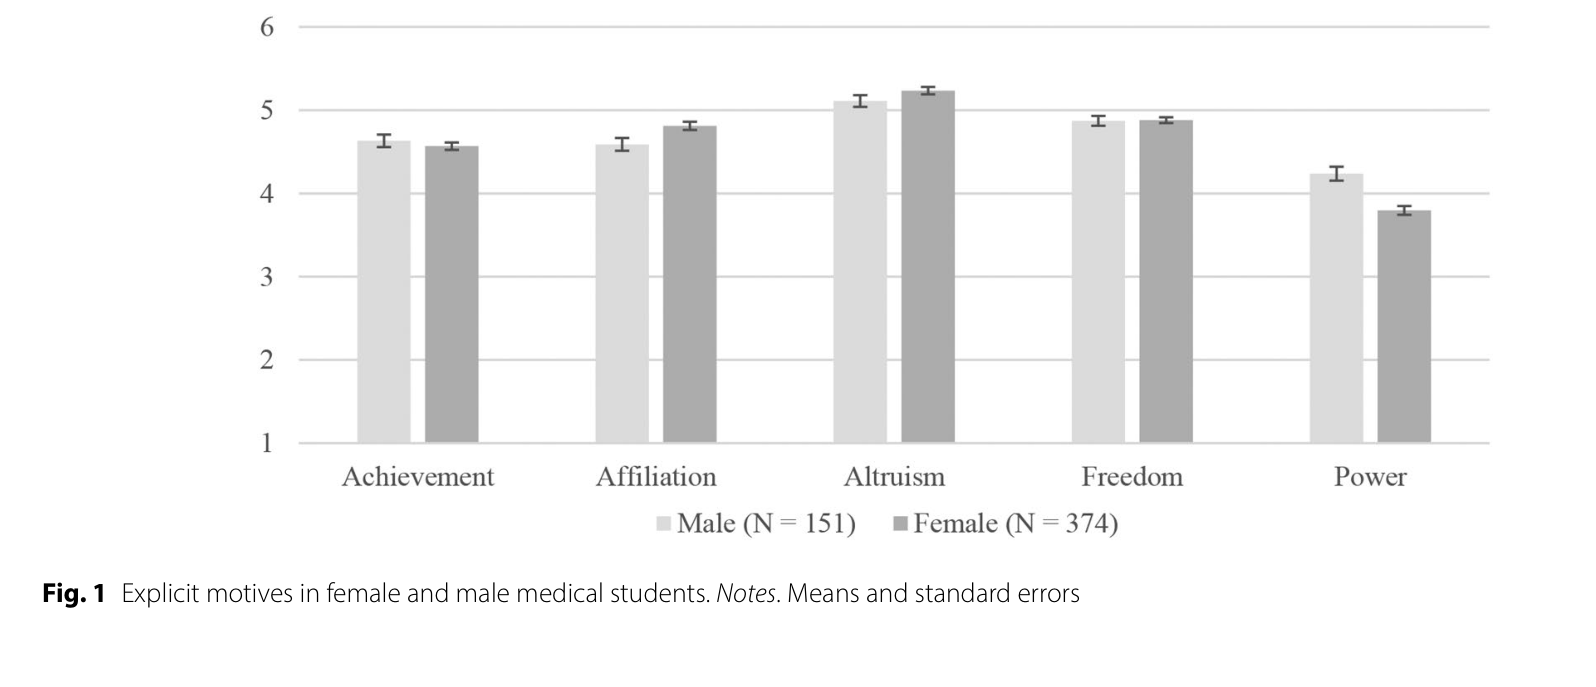
many are drawn to medicine by the wish to relieve suffering and help others (Goel et al., 2018; Rother et al., 2024).
Rother et al., 2024 Fig. 1
high
Rother et al., 2024 Fig. 1
Source caption

Fig. 1 Explicit motives in female and male medical students. Notes. Means and standard errors

A bar chart of five explicit motives — achievement, affiliation, altruism, freedom, power — rated by 525 medical students, split by gender, with standard errors. Altruism is the highest-rated motive for both women and men, and power is the lowest, which is precisely the module's claim shown as data rather than asserted. This is the single most engaging figure in the batch for an audience of practising nurses and physicians: it invites them to locate their own reason for entering the profession on the chart, which is exactly what the 'staying connected to aspiration' section is asking them to do. Reads in a few seconds and needs no statistical background.

many are drawn to medicine by the wish to relieve suffering and help others (Goel et al., 2018; Rother et al., 2024).
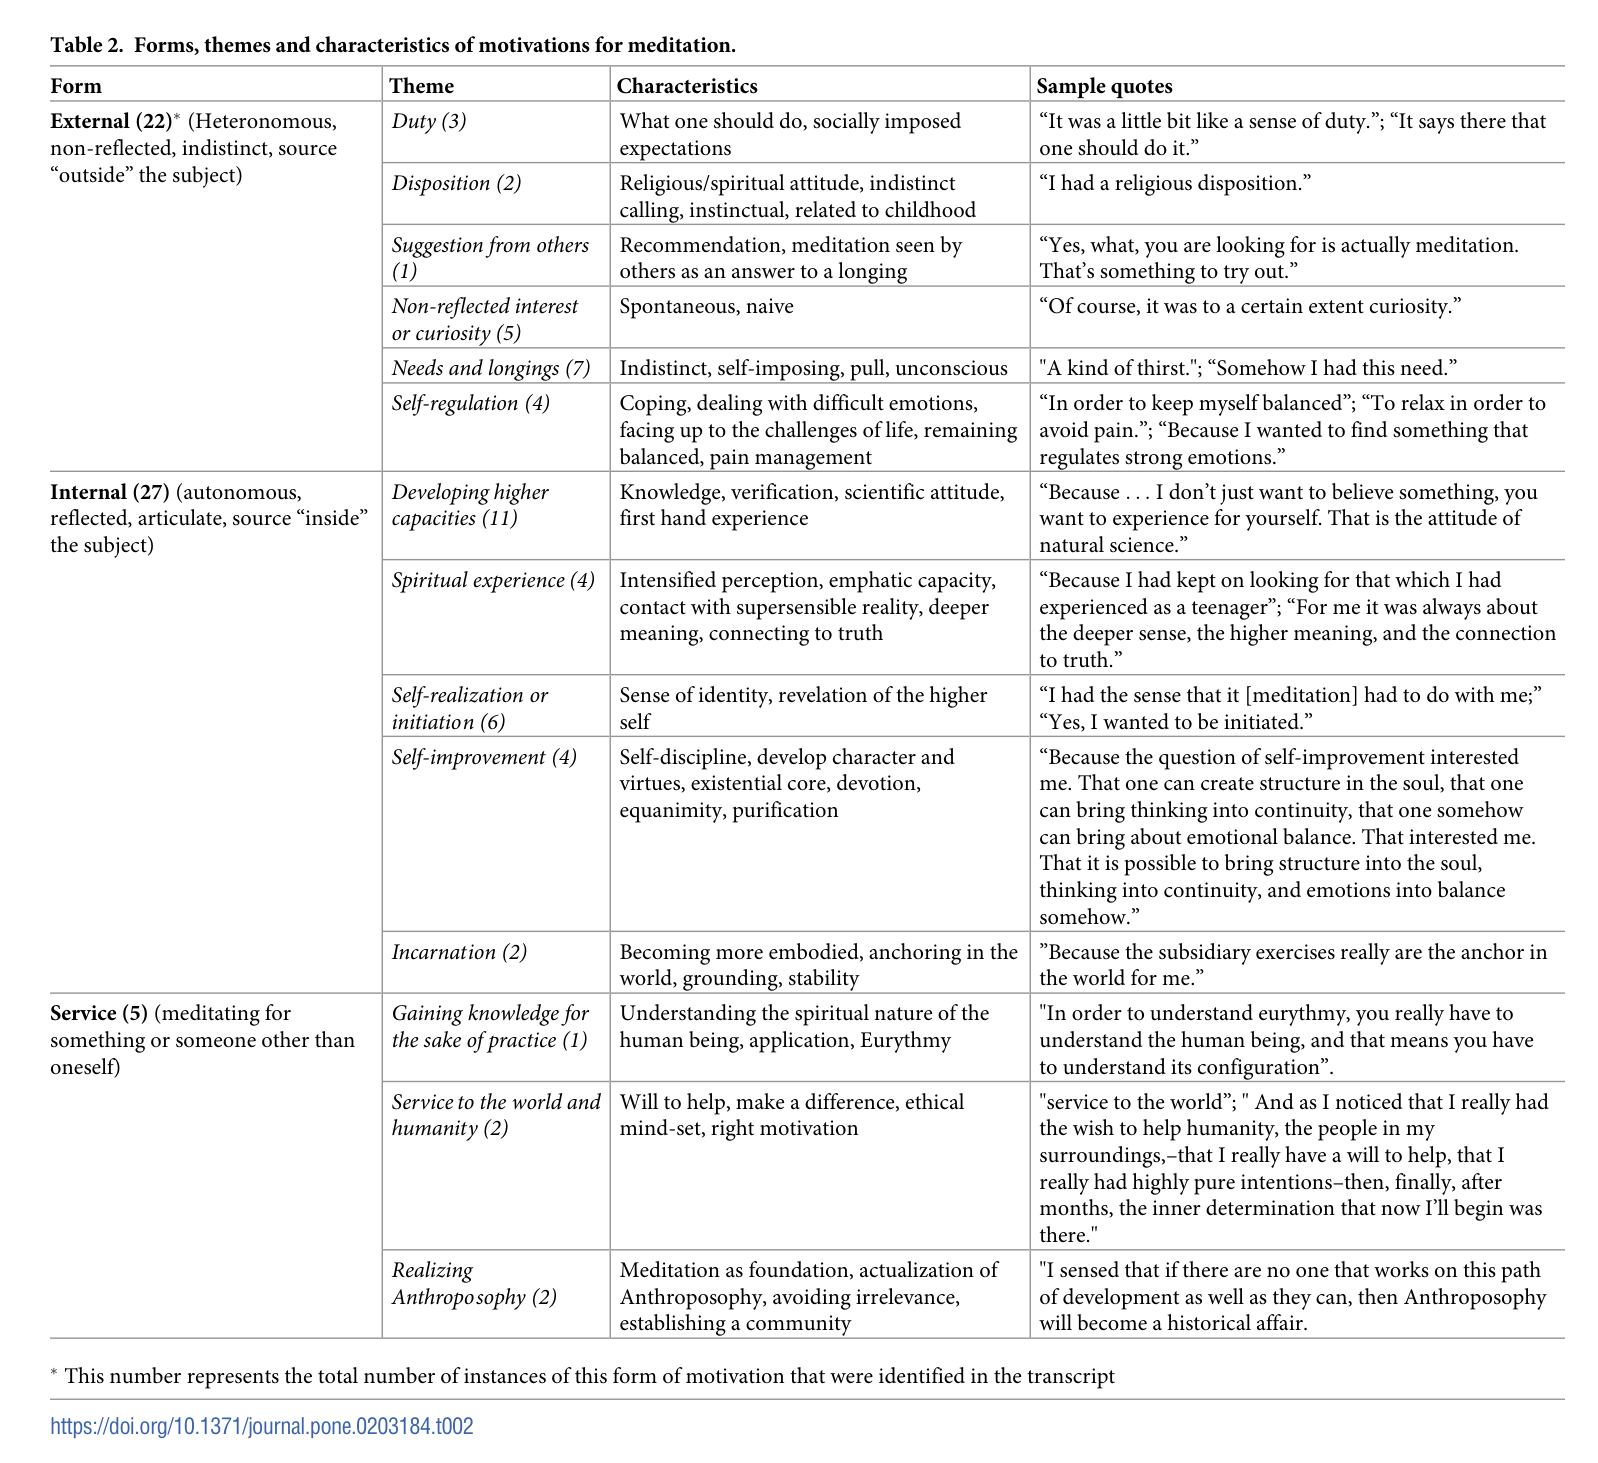
Sparby & Ott, 2018 Table 2
high
Sparby & Ott, 2018 Table 2
Source caption

Table 2. Forms, themes and characteristics of motivations for meditation.

The paper's central result, laid out as three tiers of motivation — External (duty, disposition, suggestion from others, self-regulation), Internal (developing higher capacities, spiritual experience, self-realization, self-improvement), and Service (meditating for something or someone other than oneself) — each with characteristics and verbatim participant quotes. It maps almost line-for-line onto the module sentence: the External tier includes coping and 'to relax in order to avoid pain', the Internal tier is self-understanding and balance, and the Service tier is service. The participant quotes make the progression feel human rather than schematic, which is the effect this section wants. It is a full-page table, so it needs to be reproduced at a readable size.

while many people begin meditating primarily for stress reduction or health, their motivations frequently expand to include self-understanding, balance, and service (Sparby & Ott, 2018).
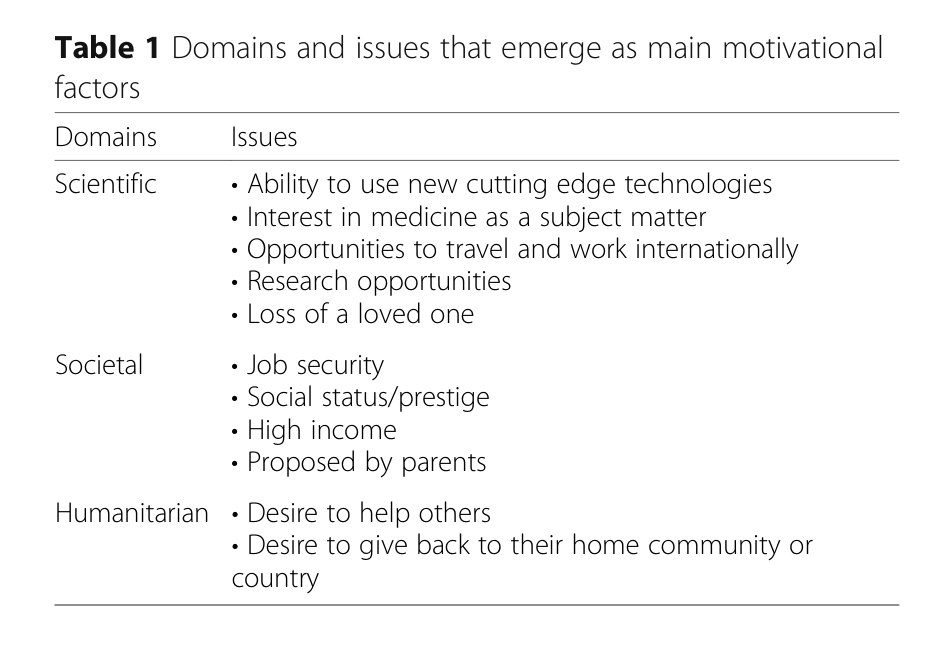
Goel et al., 2018 Table 1
medium
Goel et al., 2018 Table 1
Source caption

Table 1 Domains and issues that emerge as main motivational factors

A small three-row taxonomy sorting the motives for entering medicine into Scientific, Societal, and Humanitarian domains, with the humanitarian row reading 'Desire to help others' and 'Desire to give back to their home community or country'. It is the conceptual scaffold that Table 4 then quantifies, and it is far more compact — useful if the section wants one small graphic rather than a full ranked table. Choose this or Table 4 rather than both; Table 4 is the stronger of the pair because it carries the numbers.

many are drawn to medicine by the wish to relieve suffering and help others (Goel et al., 2018; Rother et al., 2024).
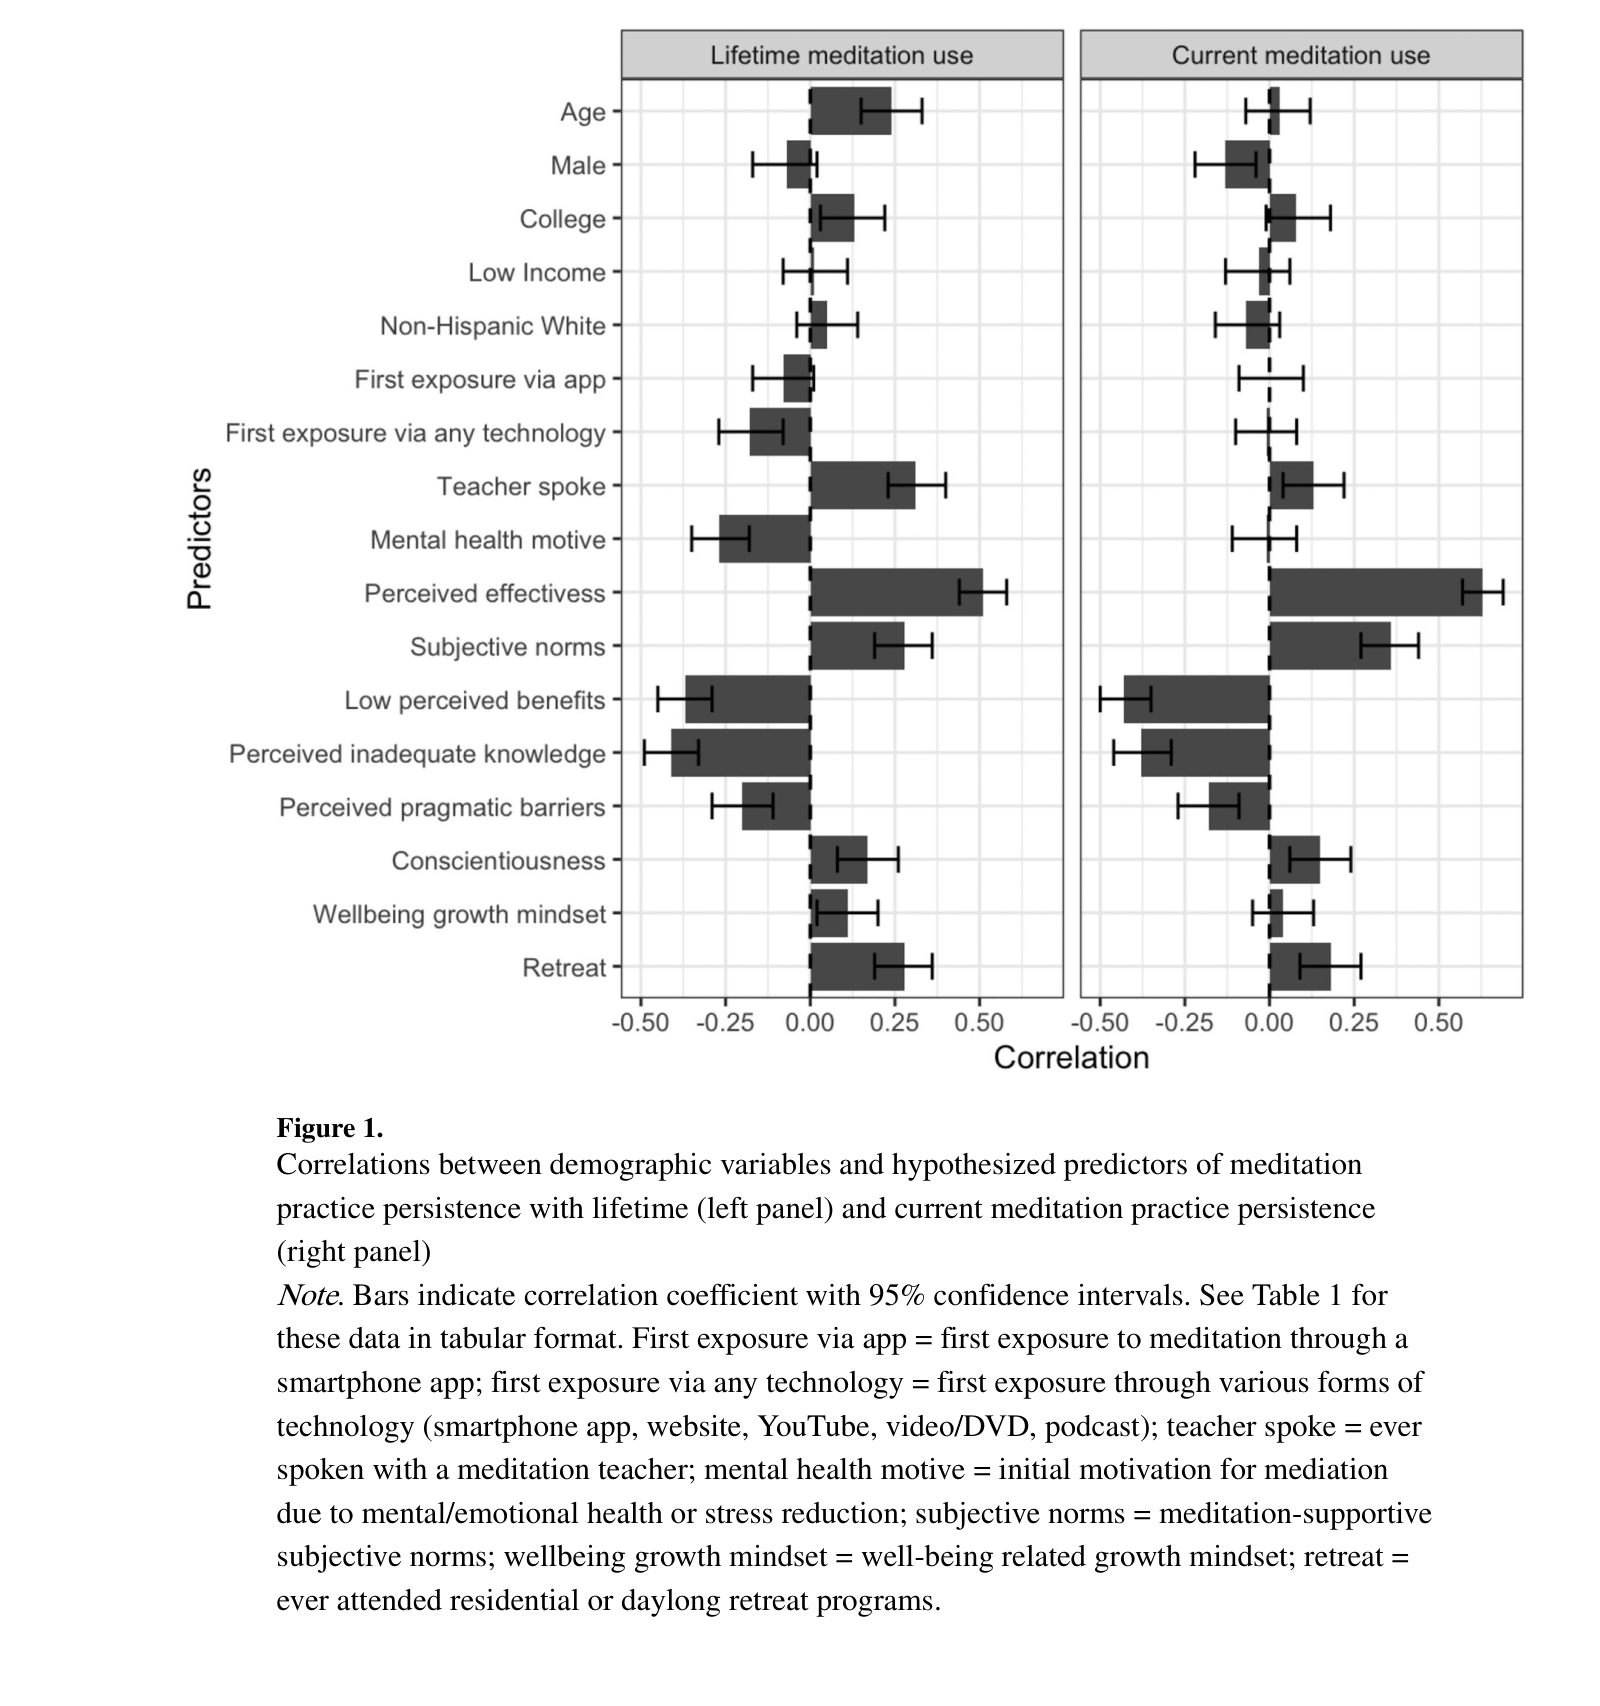
Lam et al., 2023 Figure 1
medium
Lam et al., 2023 Figure 1
Source caption

Figure 1. Correlations between demographic variables and hypothesized predictors of meditation practice persistence with lifetime (left panel) and current meditation practice persistence (right panel) Note. Bars indicate correlation coefficient with 95% confidence intervals. See Table 1 for these data in tabular format. First exposure via app = first exposure to meditation through a smartphone app; first exposure via any technology = first exposure through various forms of technology (smartphone app, website, YouTube, video/DVD, podcast); teacher spoke = ever spoken with a meditation teacher; mental health motive = initial motivation for mediation due to mental/emotional health or stress reduction; subjective norms = meditation-supportive subjective norms; wellbeing growth mindset = well-being related growth mindset; retreat = ever attended residential or daylong retreat programs.

A two-panel forest-style plot of correlations between seventeen predictors and meditation persistence, with 95% confidence intervals. The bar the module needs is 'Mental health motive' — defined in the caption as starting meditation for mental/emotional health or stress reduction — which is negatively correlated with lifetime persistence (roughly -0.20), while perceived effectiveness, subjective norms, having spoken with a teacher, and retreat attendance are all positive. Be honest in the module: this figure supports the 'stress reduction motives alone' half of the claim directly, but the study has no altruism predictor, so the altruistic-motivation half is not shown here. Readable by any science-literate clinician, though it is the densest figure in this batch.

altruistic motivations are associated with more sustained meditation practice than stress reduction motives alone (Lam et al., 2023).

Sparking warmth with a kind intention0 figures

No citations in this section of the module text.

Near enemies of recognizing warmth0 figures

No citations in this section of the module text.

Near enemies of sparking warmth0 figures

No citations in this section of the module text.

Savoring the feeling of warmth and allowing it to grow0 figures

No citations in this section of the module text.

Near enemies of savoring warmth0 figures

No citations in this section of the module text.

Savoring pleasant sensations during meditation is a trainable skill10 figures

Bryant & Veroff, 2007 Table 5.1
high
Bryant & Veroff, 2007 Table 5.1
Source caption

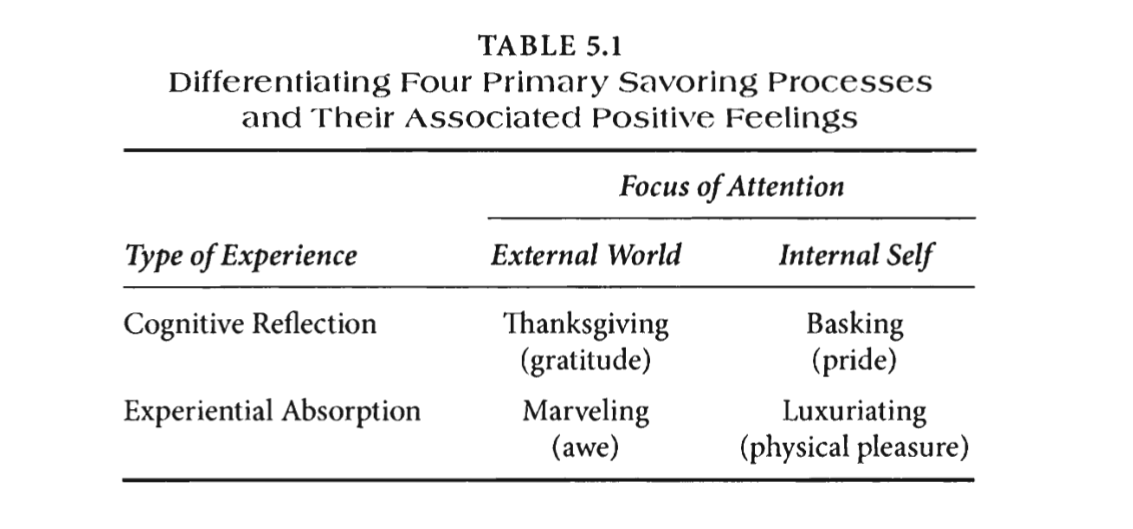
TABLE 5.1 Differentiating Four Primary Savoring Processes and Their Associated Positive Feelings

This is the single most useful figure in the batch: a compact 2x2 that crosses type of experience (cognitive reflection vs. experiential absorption) with focus of attention (external world vs. internal self), yielding the four primary savoring processes -- thanksgiving/gratitude, basking/pride, marveling/awe, and luxuriating/physical pleasure. It converts the abstract word 'savoring' into four named, recognizable states in about ten seconds of reading. For a module telling clinicians that savoring is a distinct, trainable skill, this is the definitional anchor, and 'luxuriating' (experiential absorption in physical pleasure) maps almost exactly onto the module's own topic of savoring pleasant sensations during meditation.

In the past twenty years, scientists have begun investigating savoring as a distinct and trainable skill (Bryant & Veroff, 2007).
Bryant & Veroff, 2007 Table 5.2
high
Bryant & Veroff, 2007 Table 5.2
Source caption

TABLE 5.2 Comparing the Four Main Types of Savoring Processes

The expanded companion to Table 5.1: it walks the four savoring processes across eight criteria including conceptual definition, focus of attention, dominant feeling, real-world examples, timing, and outward bodily expression. It is denser than a 20-second figure, but it reads as a reference table rather than a statistical one, and the 'outward expression' and 'real-world examples' rows are unusually concrete for clinicians (e.g. eyes closed with a satisfied 'mmm' for luxuriating). Best used as an optional expandable companion beneath Table 5.1 rather than as the primary graphic.

In the past twenty years, scientists have begun investigating savoring as a distinct and trainable skill (Bryant & Veroff, 2007).
Chen et al., 2026 Figure 3
high
Chen et al., 2026 Figure 3
Source caption

FIGURE 3 Forest plot of study-level effect sizes (Hedges' g) for savoring interventions. Note: Studies are ordered chronologically (2004-2023). Each line represents an individual randomized controlled trial (K = 20), displaying the standardized mean difference (Hedges' g) and 95% confidence interval for the intervention's effect on emotional outcomes. Black error bars denote sampling precision, whereas gray bars indicate total precision incorporating within-study variance. The diamond at the bottom shows the overall pooled effect estimated using a three-level meta-analysis with cluster-robust variance estimation (TLMA, CR2), indicating a significant medium-sized effect (g = 0.51, 95% CI [0.26, 0.77], p < .001).

The forest plot pooling 20 randomized trials of savoring interventions, with a clearly labelled overall estimate of g = 0.51 [0.26, 0.77]. This is the strongest evidentiary figure in the batch for the module's summary claim that training savoring works: it shows a medium, statistically significant pooled benefit while being honest that individual trials scatter widely and several cross zero. Well-formatted and readable at a glance, and it includes Klibert 2022 as one of its rows, which visually ties this citation to the trial described earlier in the same section.

Intervention studies similarly suggest that training this skill can strengthen well-being and resilience while reducing distress and depressive symptoms (Smith & Hanni, 2019; Smith & Hollinger-Smith, 2015; Chen et al., 2026).
Klibert et al., 2022 Figure 2
high
Klibert et al., 2022 Figure 2
Source caption

FIGURE 2 | Interaction effect between time and intervention on positive emotions. Errors bars represent standard errors of the mean.

This is precisely the condition-comparison graph the module sentence describes. Grouped bars show mean positive emotion for all five arms -- true control, guided imagery control, savoring through reminiscence, savoring through anticipation, and savoring the moment -- at three time points. The groups are indistinguishable at Time 1 and Time 2 and then fan apart at Time 3, with Savoring the Moment highest and true control lowest, which is exactly the claim that present-moment savoring outperformed no intervention, neutral imagery, and savoring a memory. A reader gets the whole result at a glance without needing the ANOVA.

In a randomized controlled trial, participants first completed a stressful social task and then practiced different forms of savoring. Focusing on positive experience in the present moment helped participants experience positive emotion. It was more effective than no intervention, neutral guided imagery, or savoring a memory (Klibert et al., 2022).
Smith & Hanni, 2019 Figure 3
high
Smith & Hanni, 2019 Figure 3
Source caption

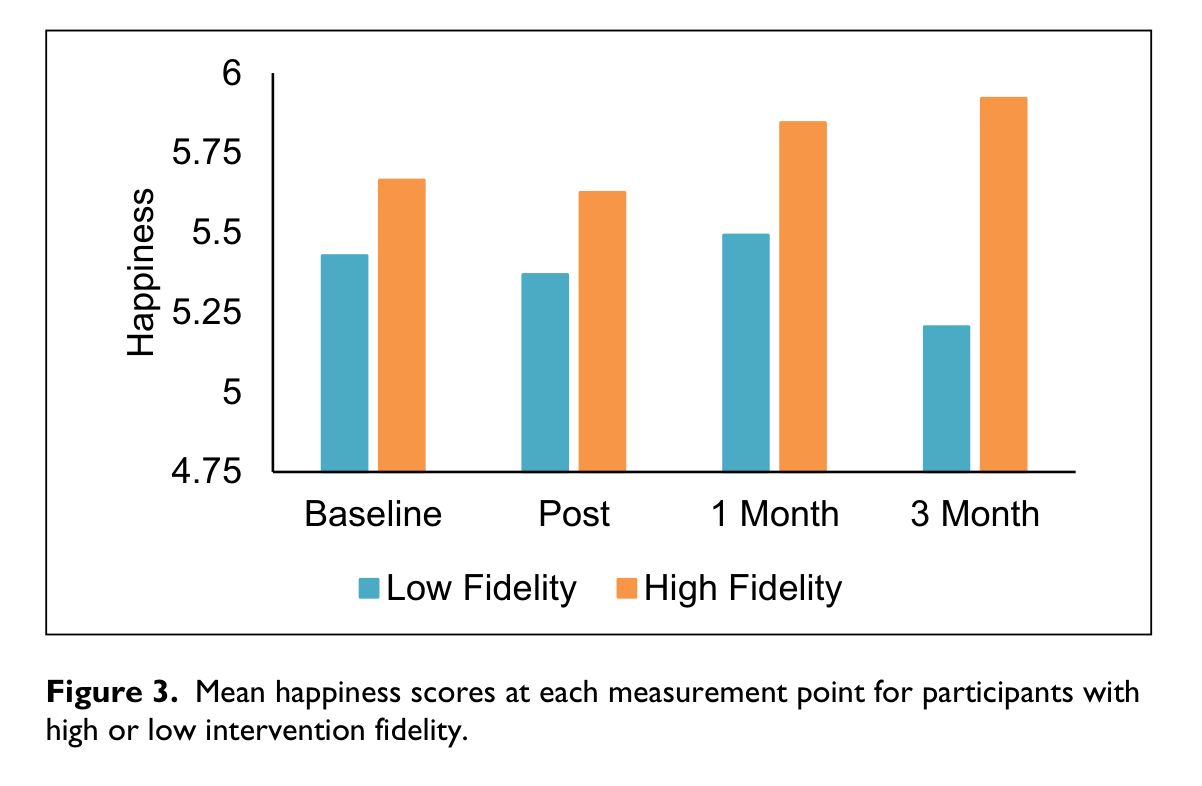
Figure 3. Mean happiness scores at each measurement point for participants with high or low intervention fidelity.

Mean happiness at baseline, post-intervention, 1 month, and 3 months, split by whether participants actually completed the savoring practice (high vs. low fidelity). The two groups start close together and then diverge, with the high-fidelity group highest at the 3-month follow-up -- directly supporting the module's clause that gains were still evident three months later. The dose-response framing (people who practiced more benefited more) also reinforces the section's core premise that savoring is a trainable skill rather than a trait.

In one study, a week of savoring practice increased happiness, life satisfaction, and resilience, with many of these gains still evident three months later (Smith & Hanni, 2019).
Smith & Hanni, 2019 Figure 1
high
Smith & Hanni, 2019 Figure 1
Source caption

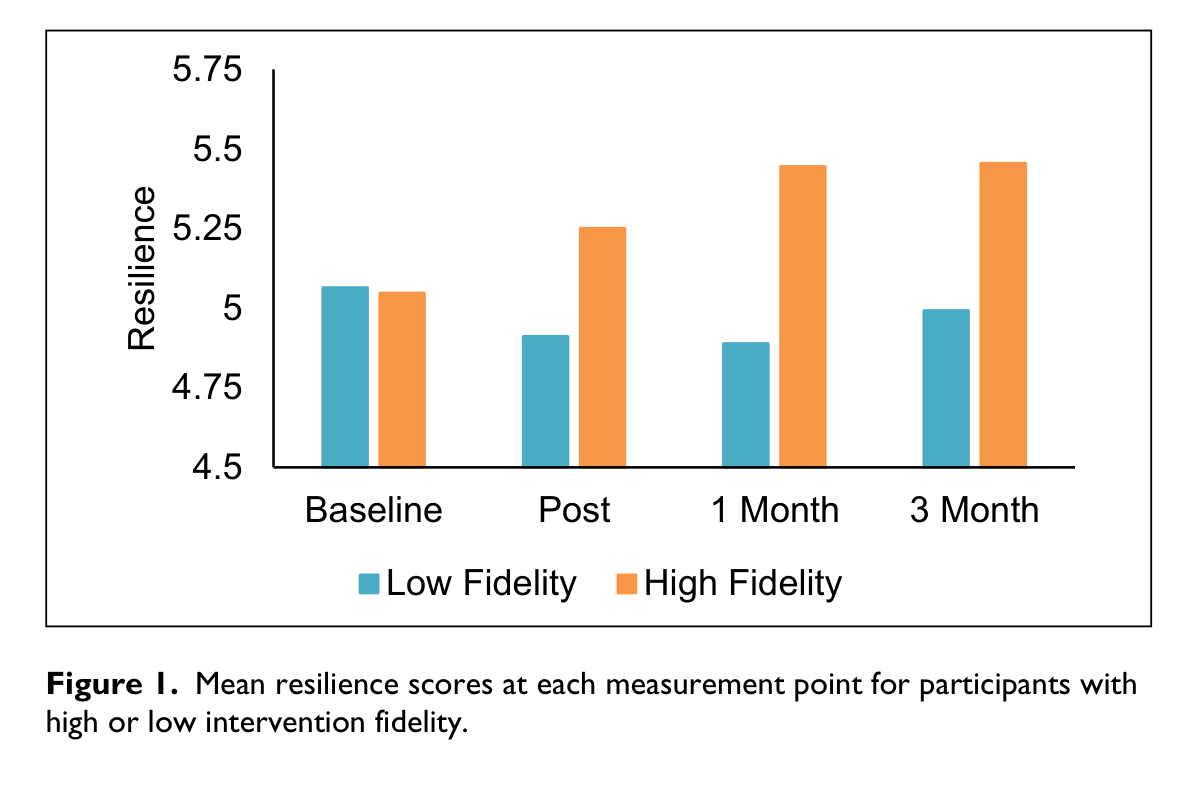
Figure 1. Mean resilience scores at each measurement point for participants with high or low intervention fidelity.

The resilience counterpart to Figure 3, on the same four-point timeline through the 3-month follow-up. The separation is cleaner here than for happiness: the two groups are identical at baseline and the high-fidelity group rises and stays elevated at 1 and 3 months while the low-fidelity group does not. Resilience is the outcome most likely to matter to a nurse or physician audience, so if only one Smith and Hanni figure is used, this is the stronger choice.

In one study, a week of savoring practice increased happiness, life satisfaction, and resilience, with many of these gains still evident three months later (Smith & Hanni, 2019).
Bryant & Veroff, 2007 FIG. 4.1
medium
Bryant & Veroff, 2007 FIG. 4.1
Source caption

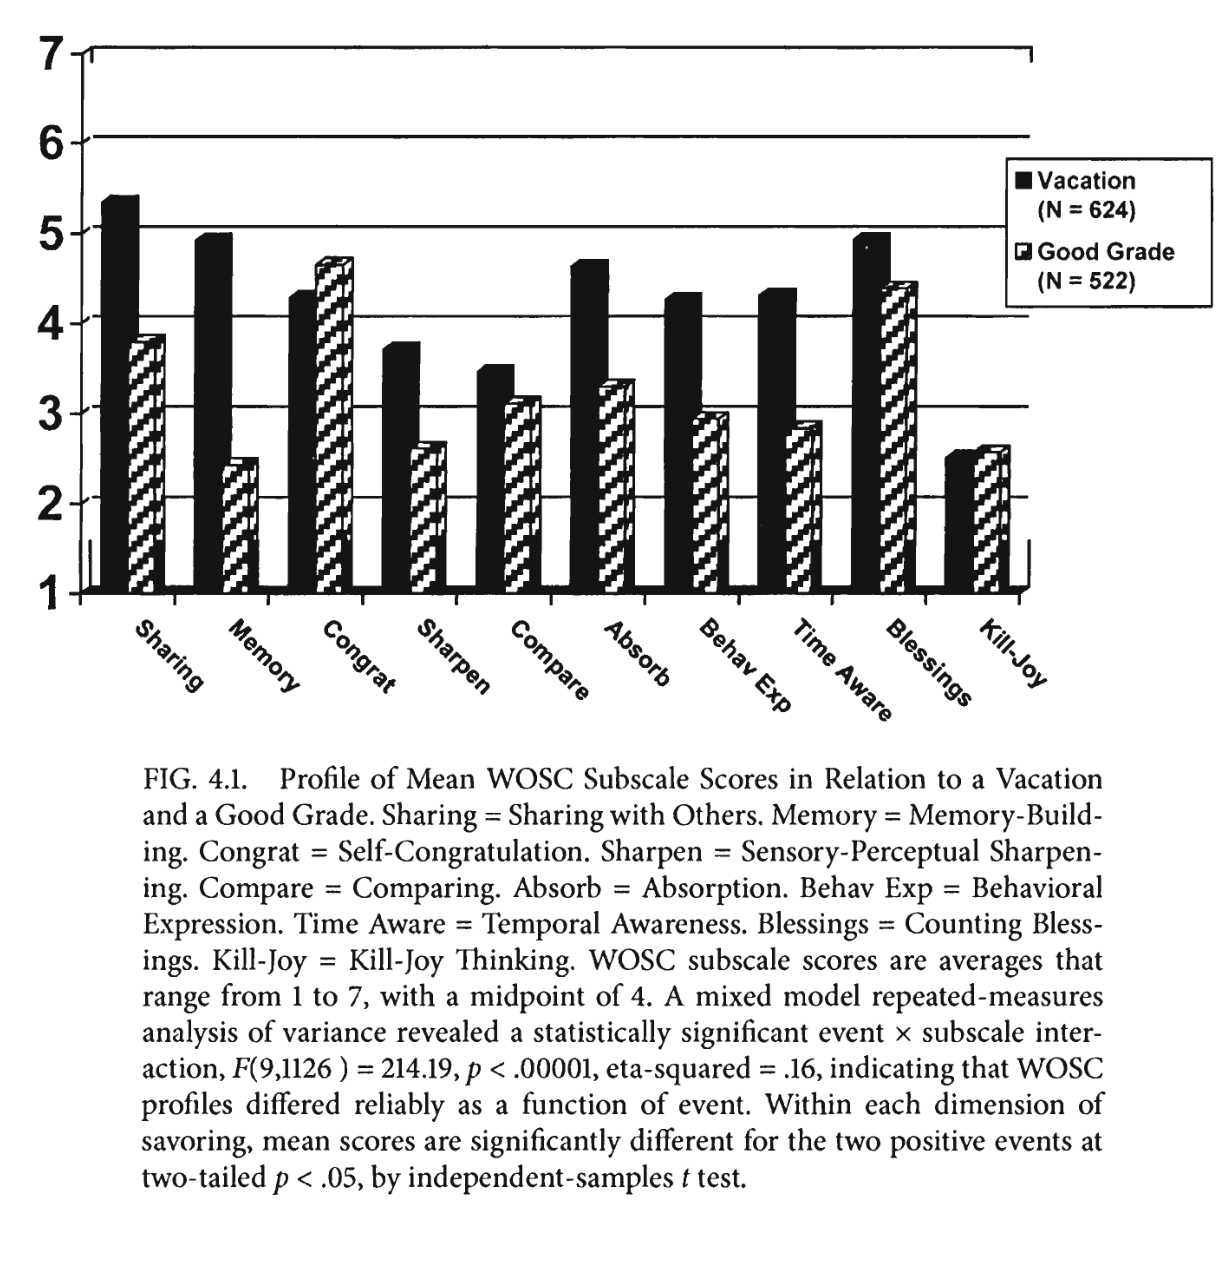
FIG. 4.1. Profile of Mean WOSC Subscale Scores in Relation to a Vacation and a Good Grade. Sharing = Sharing with Others. Memory = Memory-Building. Congrat = Self-Congratulation. Sharpen = Sensory-Perceptual Sharpening. Compare = Comparing. Absorb = Absorption. Behav Exp = Behavioral Expression. Time Aware = Temporal Awareness. Blessings = Counting Blessings. Kill-Joy = Kill-Joy Thinking. WOSC subscale scores are averages that range from 1 to 7, with a midpoint of 4. A mixed model repeated-measures analysis of variance revealed a statistically significant event x subscale interaction, F(9,1126) = 214.19, p < .00001, eta-squared = .16, indicating that WOSC profiles differed reliably as a function of event. Within each dimension of savoring, mean scores are significantly different for the two positive events at two-tailed p < .05, by independent-samples t test.

A bar chart of the ten measured savoring strategies from the Ways of Savoring Checklist, contrasting how people savored a vacation versus a good grade. Its value for this module is the x-axis itself -- it names ten concrete, measurable savoring strategies (sensory-perceptual sharpening, absorption, temporal awareness, counting blessings, kill-joy thinking), which is the strongest single piece of evidence that savoring has been operationalized as a skill with identifiable components. The specific vacation-versus-grade comparison is tangential to the module's claim, so the figure is only loosely relevant beyond the strategy labels.

In the past twenty years, scientists have begun investigating savoring as a distinct and trainable skill (Bryant & Veroff, 2007).
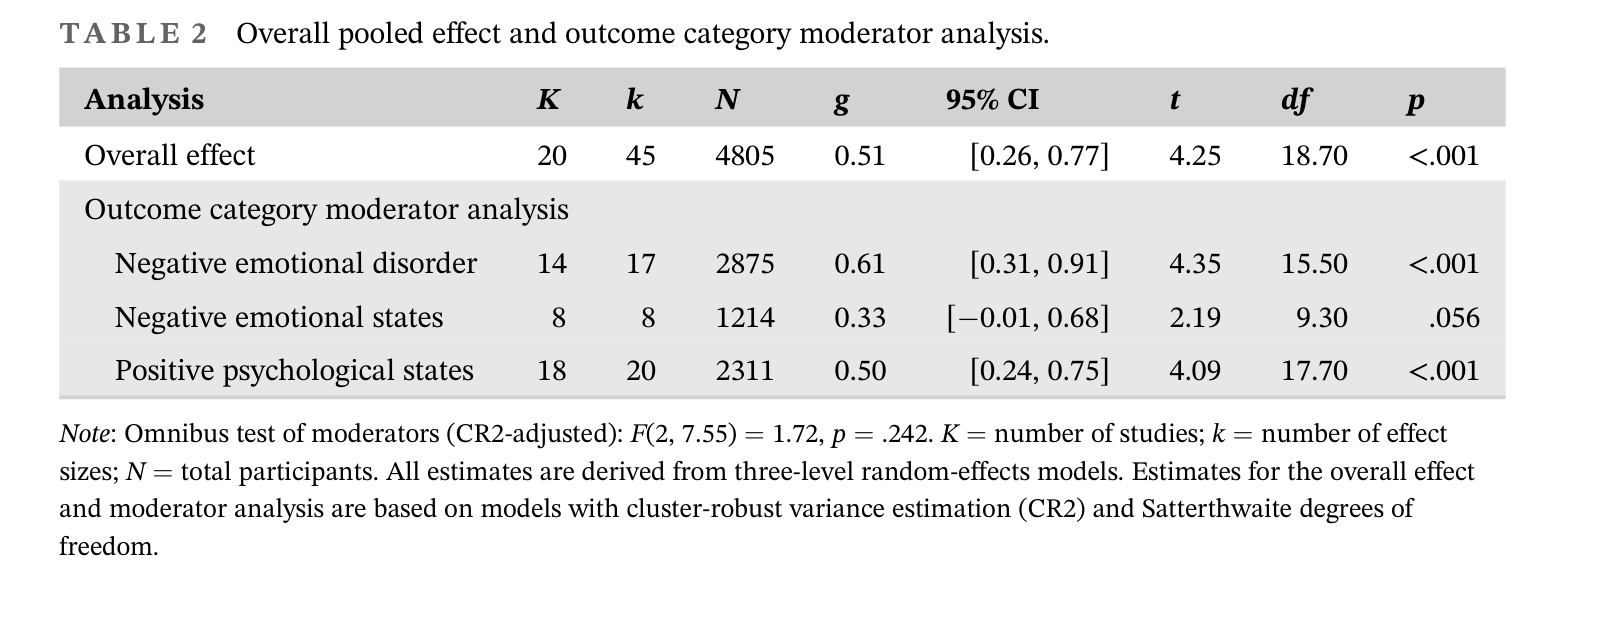
Chen et al., 2026 Table 2
medium
Chen et al., 2026 Table 2
Source caption

TABLE 2 Overall pooled effect and outcome category moderator analysis. Note: Omnibus test of moderators (CR2-adjusted): F(2, 7.55) = 1.72, p = .242. K = number of studies; k = number of effect sizes; N = total participants. All estimates are derived from three-level random-effects models. Estimates for the overall effect and moderator analysis are based on models with cluster-robust variance estimation (CR2) and Satterthwaite degrees of freedom.

A four-row summary breaking the pooled effect down by outcome type: negative emotional disorder g = 0.61, negative emotional states g = 0.33, and positive psychological states g = 0.50, across 4,805 participants. This maps unusually well onto the module sentence, which claims benefits on both sides of the ledger -- strengthening well-being and reducing distress and depressive symptoms. It is a statistics table rather than a graphic, so it is a supporting element to the forest plot; note also that the negative-emotional-states estimate is not significant (p = .056).

Intervention studies similarly suggest that training this skill can strengthen well-being and resilience while reducing distress and depressive symptoms (Smith & Hanni, 2019; Smith & Hollinger-Smith, 2015; Chen et al., 2026).
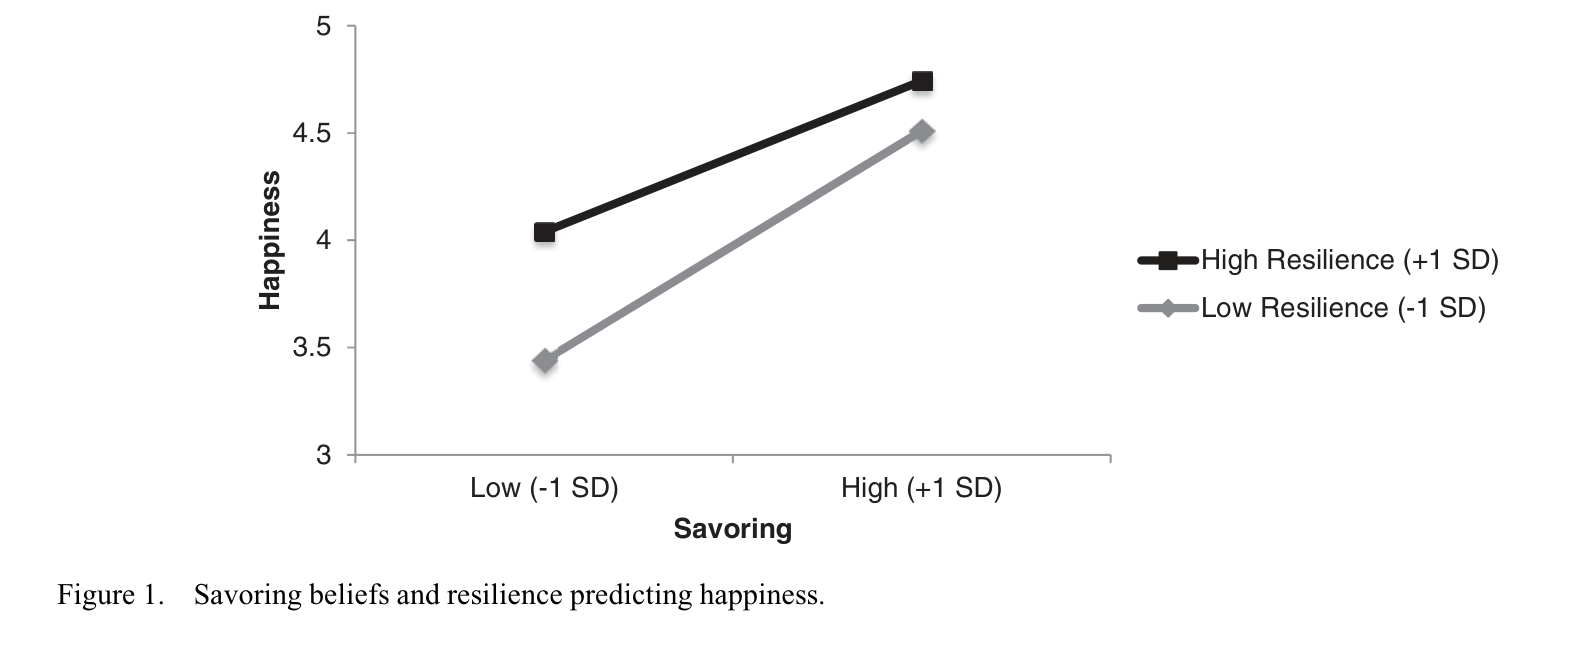
Smith & Hollinger-Smith, 2015 Figure 1
medium
Smith & Hollinger-Smith, 2015 Figure 1
Source caption

Figure 1. Savoring beliefs and resilience predicting happiness.

A simple two-line plot showing happiness rising from low to high savoring beliefs, for older adults at both high and low resilience. It supports the 'greater happiness' half of the claim in a form any reader can parse instantly. It is a correlational moderation plot rather than an intervention result, and the resilience split is extra machinery the module does not discuss, so it is worth including only if the section wants a visual for the association claim.

savoring has been associated with greater happiness, optimism, self-esteem, and life satisfaction, as well as lower depression.
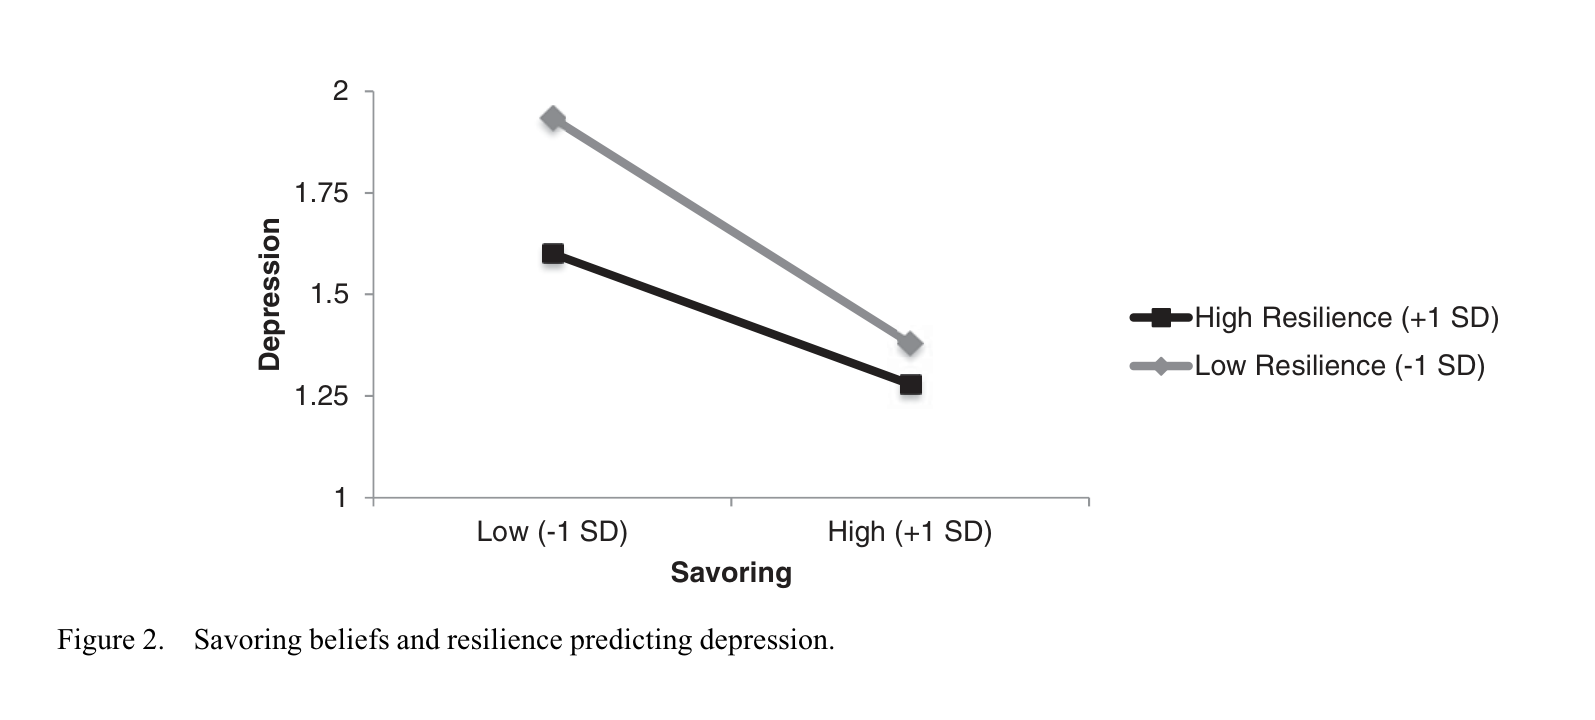
Smith & Hollinger-Smith, 2015 Figure 2
medium
Smith & Hollinger-Smith, 2015 Figure 2
Source caption

Figure 2. Savoring beliefs and resilience predicting depression.

The mirror image of Figure 1: depression scores fall as savoring beliefs rise, and the drop is steepest for people low in resilience. This covers the 'as well as lower depression' clause and, paired with Figure 1, gives the section a clean up-and-down visual for the association. Same caveats apply -- cross-sectional, older-adult sample, and the resilience moderation is not part of the module's argument.

savoring has been associated with greater happiness, optimism, self-esteem, and life satisfaction, as well as lower depression.

Introducing the 4R Framework1 figure

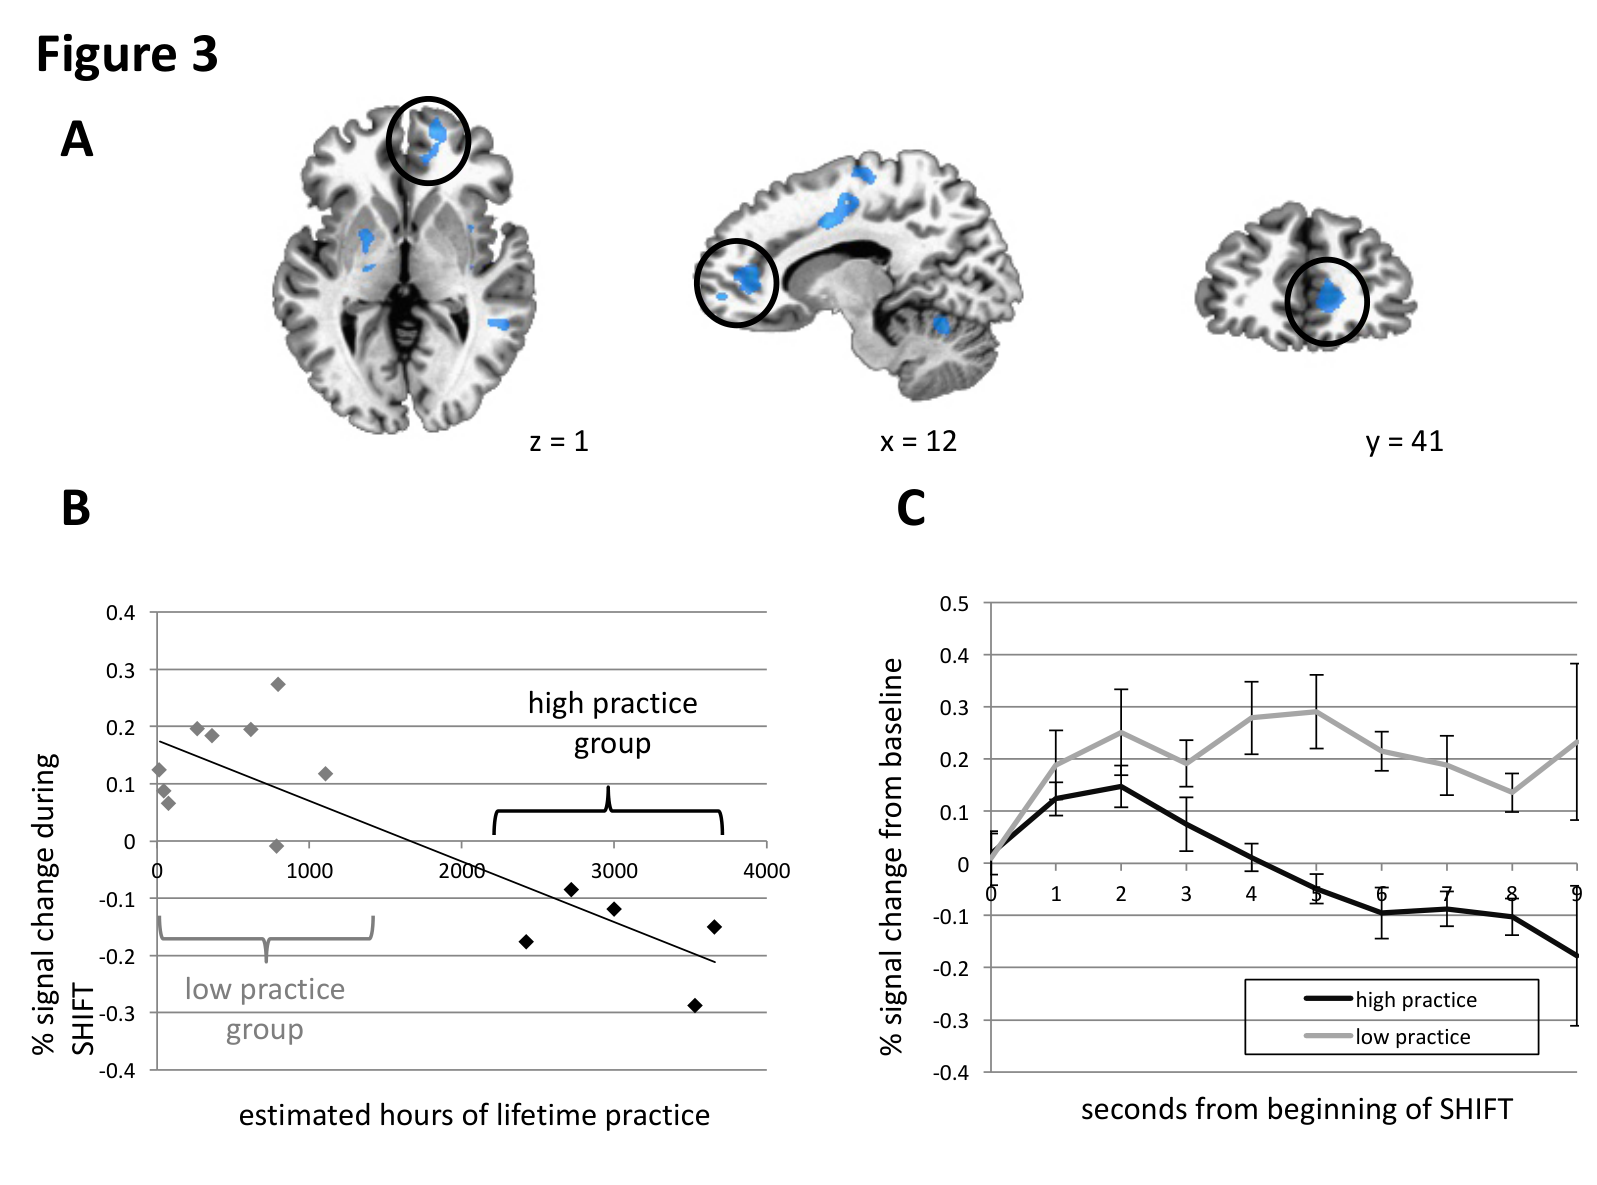
Hasenkamp, 2012 Figure 3
medium
Hasenkamp, 2012 Figure 3
Source caption

Figure 3. Practice time effects. A) Several clusters that were negatively correlated with practice time during the SHIFT phase. The ventromedial PFC cluster that was examined in B ad C is circled. B) Scatter plot of the relationship between practice time and fMRI signal in the ventromedial PFC cluster. Participants with high and low practice time are clearly segregated. C) Time courses from the ventromedial PFC cluster were extracted, and HRFs were calculated from the onset of the SHIFT phase for each subject. Percent signal change (from MW, mean s.e.m.) over time is plotted for high (N=5) and low (N=9) practice participants. The BOLD response is significantly reduced in high practice compared to low practice participants across the modeled time series. * Main effect of group over time by repeated-measures ANOVA, p = 0.010.

Panel B is the only figure in the paper that displays lifetime practice hours: its x-axis runs 0 to 4000 estimated hours, with an explicitly bracketed 'high practice group' whose data points sit between roughly 2,200 and 3,700 hours. That directly substantiates the module's '3,000 lifetime hours' detail, and every plotted dot is a meditator who generated mind-wandering button presses inside the scanner, so the sample itself makes the point that experience does not eliminate mind wandering. Honest caveat: the figure does not itself plot mind-wandering frequency -- the numbers behind 'their minds still wandered regularly' are text-only (p. 12-13: an average of 15.5 button presses, about one mind-wandering event every 80 seconds across the 20-minute session, with press counts not correlating with practice time, r = -0.14, p = 0.64, and not differing between the high- and low-practice groups). If the authors want a figure for the second half of the claim there isn't one; those statistics would need to be quoted as text. Panels A and C are about speed of disengagement in ventromedial PFC and are more technical than this section needs, so consider cropping to panel B alone when reproducing.

For instance, the fMRI study with button pressing we mentioned at the start of this class specifically recruited experienced meditators. This included some meditators with over 3,000 lifetime hours of practice, and the researchers found that their minds still wandered regularly (Hasenkamp, 2012).

Recognizing when distraction arises4 figures

Levy-Gigi et al., 2022 Fig 2
high
Levy-Gigi et al., 2022 Fig 2
Source caption

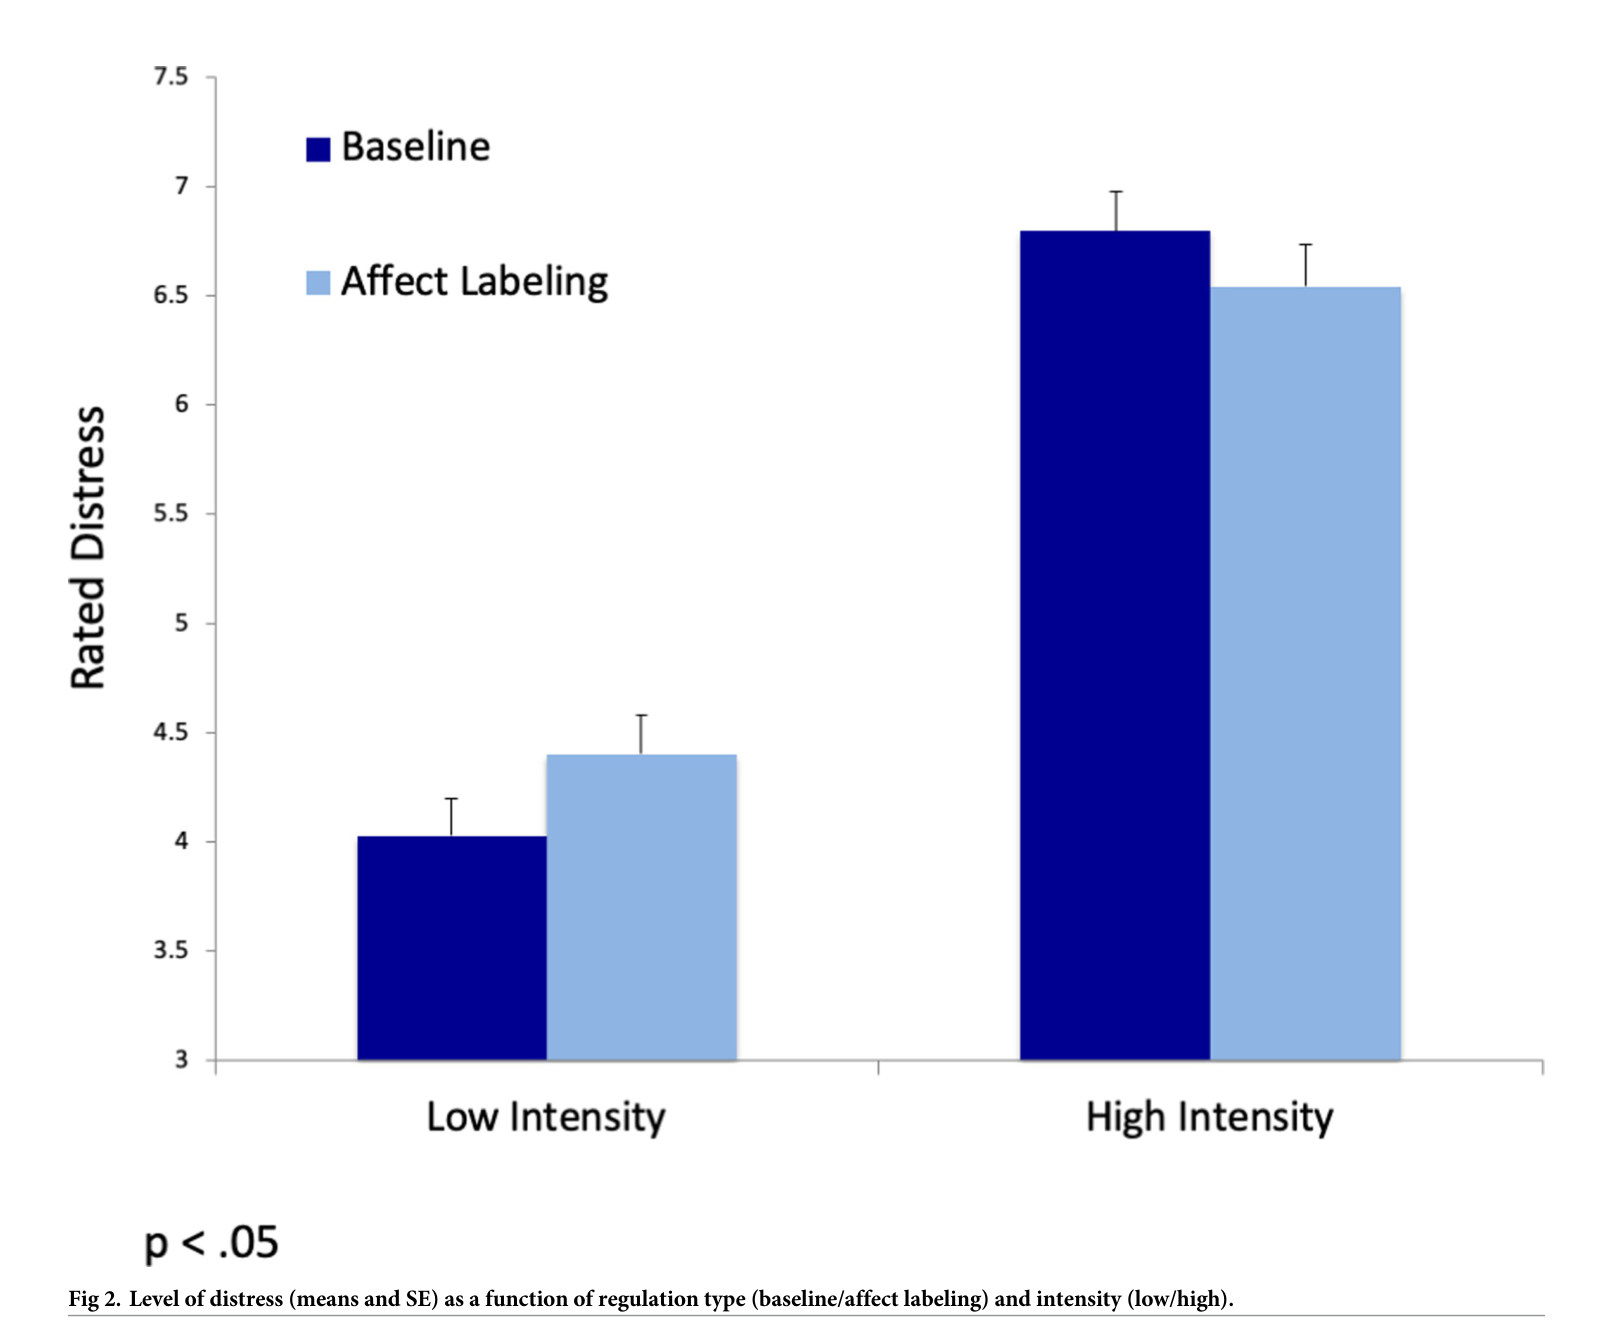
Fig 2. Level of distress (means and SE) as a function of regulation type (baseline/affect labeling) and intensity (low/high).

A simple four-bar chart: naming the feeling lowered rated distress when the triggering image was highly intense, but slightly raised distress when the image was only mildly intense. This is exactly the 'sometimes helps' nuance the module sentence is making, and it gives a reader a concrete rule of thumb (labeling pays off when the emotion is strong, not when it is mild). Readable in well under 20 seconds with no specialist knowledge.

beginners sometimes benefit from using brief mental labels, like 'planning,' 'worrying,' or 'daydreaming.' This can sometimes help clarify the moment of recognition, and there's also evidence that it may reduce distress in some cases (Levy-Gigi et al., 2022).
Nook et al., 2021 Fig. 4
high
Nook et al., 2021 Fig. 4
Source caption

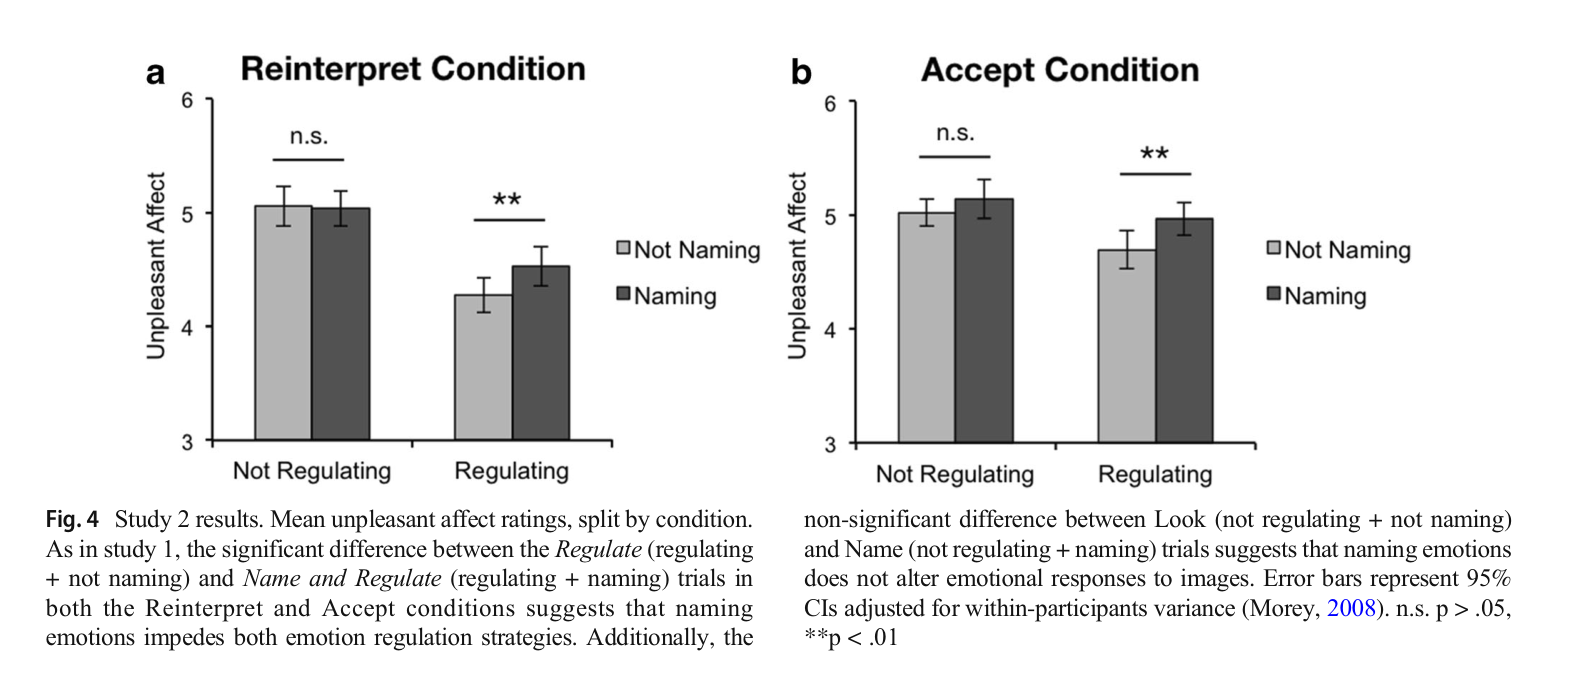
Fig. 4 Study 2 results. Mean unpleasant affect ratings, split by condition. As in study 1, the significant difference between the Regulate (regulating + not naming) and Name and Regulate (regulating + naming) trials in both the Reinterpret and Accept conditions suggests that naming emotions impedes both emotion regulation strategies. Additionally, the non-significant difference between Look (not regulating + not naming) and Name (not regulating + naming) trials suggests that naming emotions does not alter emotional responses to images. Error bars represent 95% CIs adjusted for within-participants variance (Morey, 2008). n.s. p > .05, **p < .01

Two side-by-side panels showing that when people tried to regulate an emotion, adding a verbal label left them feeling worse than regulating alone — and that this held for both reinterpretation (panel a) and acceptance (panel b). The acceptance panel matters here because acceptance is the strategy closest to what meditators are doing, so this is the strongest available image for the module's caveat that labeling can make emotions feel more stuck. Bars are close together, so the caption's significance markers carry the message; still readable at a glance.

However, labeling can also sometimes make emotions feel more fixed or stuck (Nook et al., 2021), so we encourage you to experiment.
Nook et al., 2021 Fig. 2
medium
Nook et al., 2021 Fig. 2
Source caption

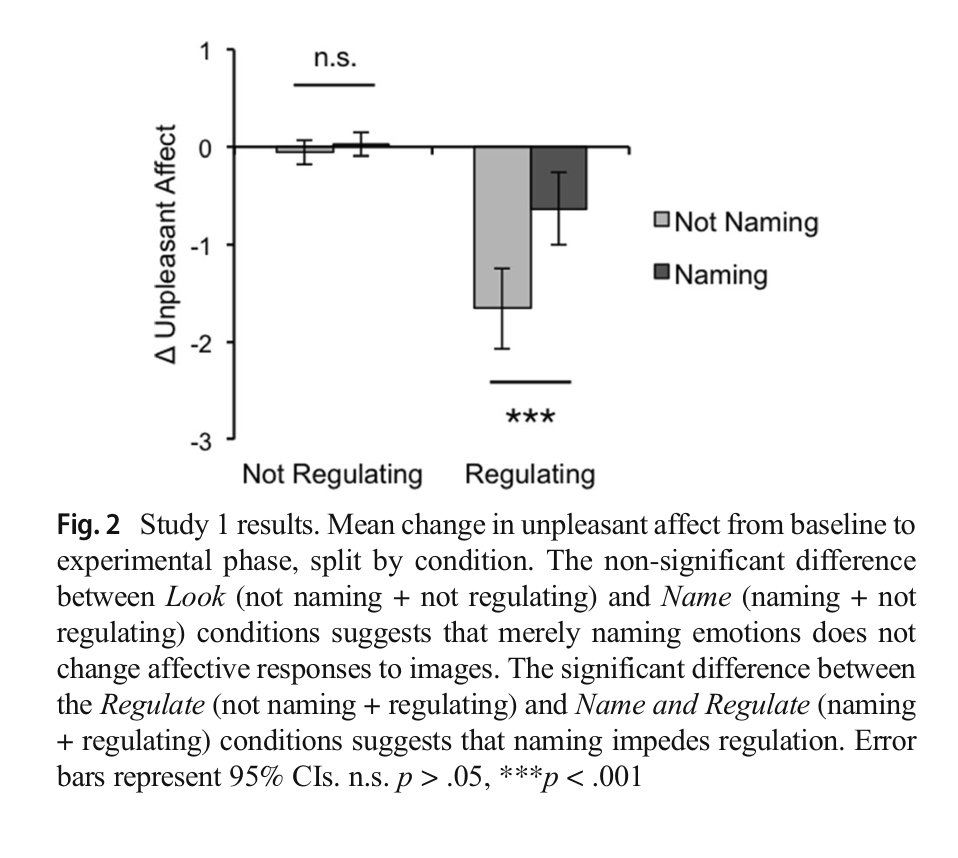
Fig. 2 Study 1 results. Mean change in unpleasant affect from baseline to experimental phase, split by condition. The non-significant difference between Look (not naming + not regulating) and Name (naming + not regulating) conditions suggests that merely naming emotions does not change affective responses to images. The significant difference between the Regulate (not naming + regulating) and Name and Regulate (naming + regulating) conditions suggests that naming impedes regulation. Error bars represent 95% CIs. n.s. p > .05, ***p < .001

The Study 1 version of the same finding, and visually the easier of the two: naming on its own changed nothing, but when people tried to regulate, the naming bar dropped only about a third as far as the not-naming bar. If the authors want one small figure rather than the two-panel Fig. 4, this is the cleaner choice; Fig. 4 is the stronger one because it covers acceptance as well as reappraisal.

However, labeling can also sometimes make emotions feel more fixed or stuck (Nook et al., 2021), so we encourage you to experiment.
Levy-Gigi et al., 2022 Fig 1
low
Levy-Gigi et al., 2022 Fig 1
Source caption

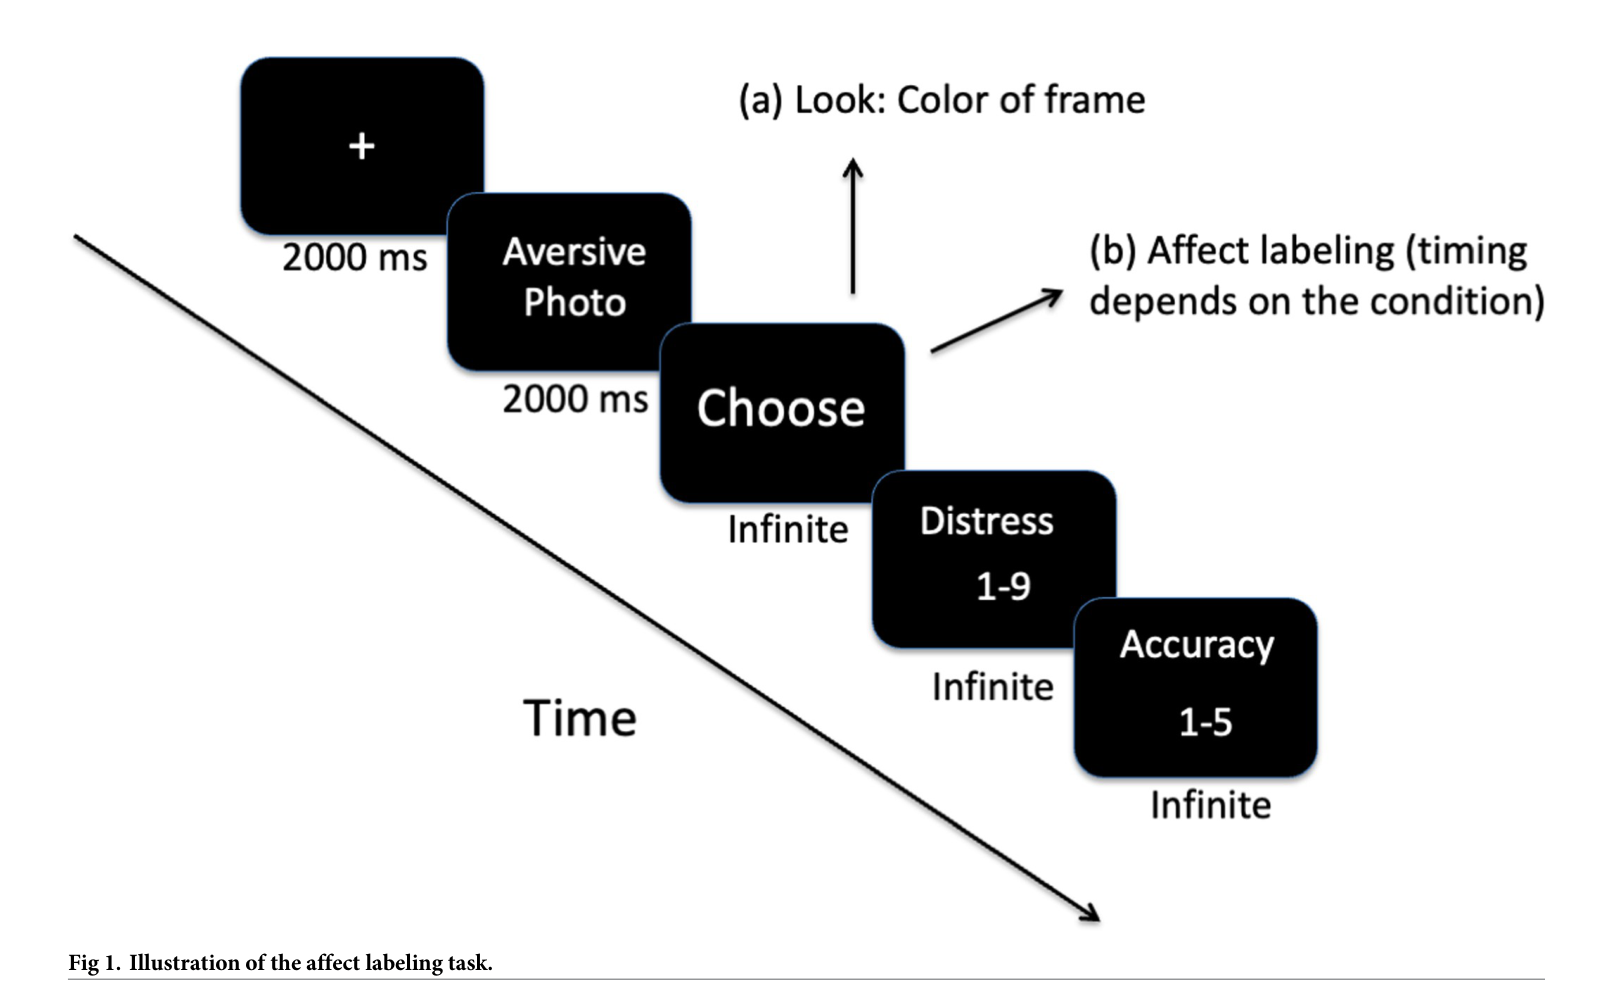
Fig 1. Illustration of the affect labeling task.

A clean trial-timeline schematic showing what 'affect labeling' means operationally: view an aversive photo, then either just look or choose a label, then rate distress. It is orientation rather than evidence, and the lab paradigm is a fair distance from labeling a distraction mid-meditation. Include only if the authors want to show readers what the underlying experiment actually asked people to do; otherwise skip.

beginners sometimes benefit from using brief mental labels, like 'planning,' 'worrying,' or 'daydreaming.' This can sometimes help clarify the moment of recognition, and there's also evidence that it may reduce distress in some cases (Levy-Gigi et al., 2022).

Near enemies of recognizing0 figures

No citations in this section of the module text.

The recognition step as a trainable attention skill5 figures

Lin et al., 2019 Figure 1
high
Lin et al., 2019 Figure 1
Source caption

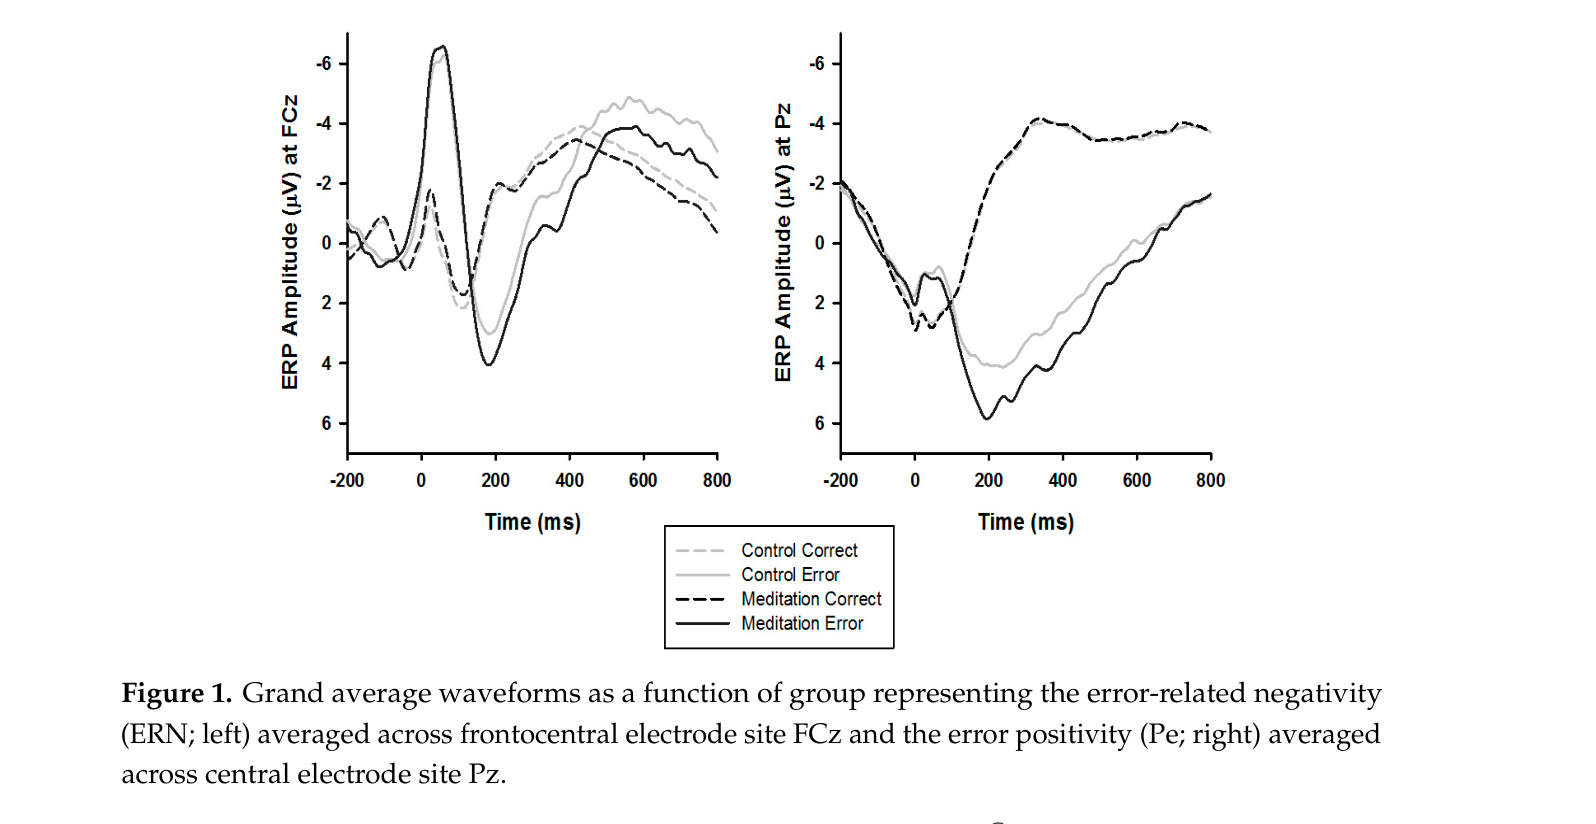
Figure 1. Grand average waveforms as a function of group representing the error-related negativity (ERN; left) averaged across frontocentral electrode site FCz and the error positivity (Pe; right) averaged across central electrode site Pz.

This is the module's claim made visible: the left panel is the error-related negativity, and the solid black 'Meditation Error' trace dips further than the grey 'Control Error' trace in the ~0-100 ms window after a mistake. It literally shows the brain catching an error within a tenth of a second, which is the neural analogue of the Recognize step. Readers will need one sentence of scaffolding (that downward = larger response, and that the axis is inverted with negative up), but the group difference is legible without EEG training.

researchers used EEG to measure brain responses while participants rapidly identified visual targets among multiple competing distractions (Lin et al., 2019). Compared to a control group, participants who completed a 20-minute open-monitoring meditation displayed a stronger signal associated with noticing their mistakes. A single session wasn't enough to improve actual performance on the task, but it did strengthen the neurological signal associated with catching mistakes.
Mao et al., 2023 Fig. 3
medium
Mao et al., 2023 Fig. 3
Source caption

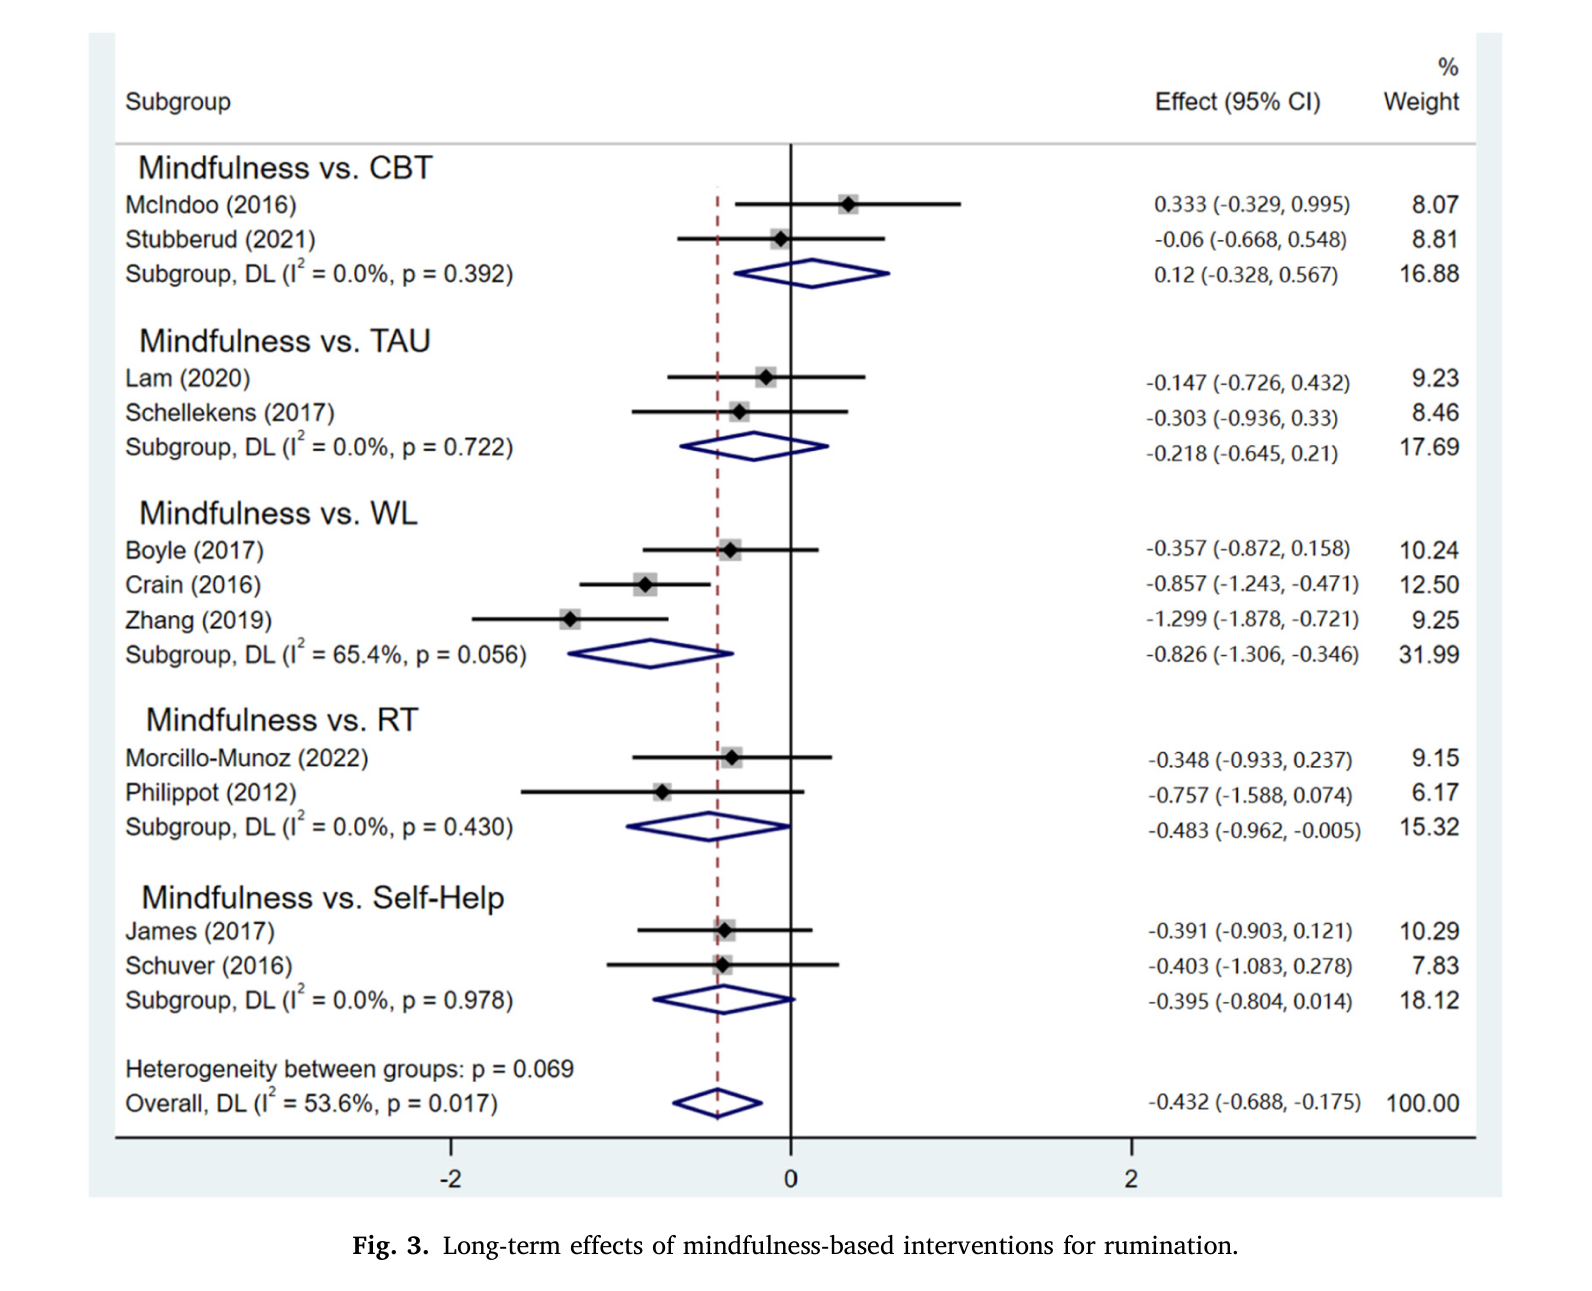
Fig. 3. Long-term effects of mindfulness-based interventions for rumination.

The only forest plot in this paper that plots rumination: 11 trials grouped by comparison condition, with an overall pooled effect of -0.43 (95% CI -0.69 to -0.18) favouring mindfulness. It communicates 'the effect holds up across studies and persists at follow-up' at a glance. The honest caveat is that this shows the long-term (follow-up) effect, whereas the module sentence is about the headline post-intervention result — that one lives in Table 2 (p. 7, total SMD -0.534 across 61 comparisons), which is a 61-row table and far too dense to reproduce.

a meta-analysis of depressed populations found that mindfulness-based interventions decreased unhelpful repetitive thinking (Mao et al., 2023).
Lin et al., 2019 Figure 2
low
Lin et al., 2019 Figure 2
Source caption

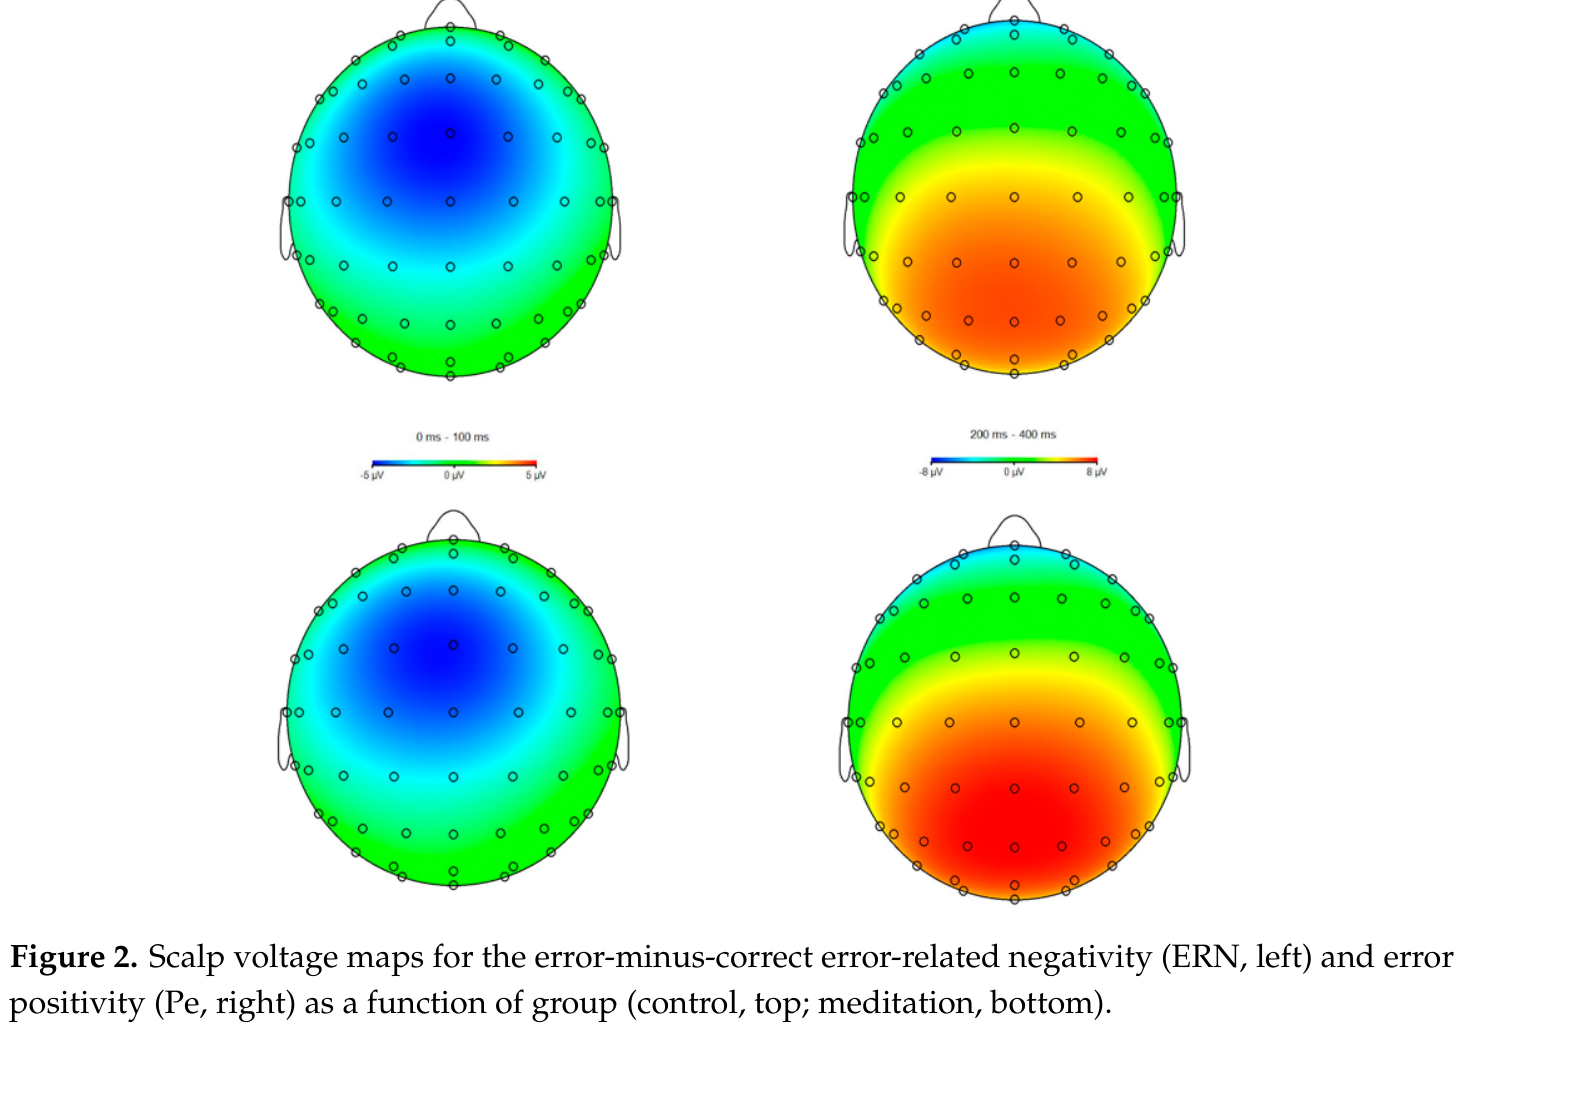
Figure 2. Scalp voltage maps for the error-minus-correct error-related negativity (ERN, left) and error positivity (Pe, right) as a function of group (control, top; meditation, bottom).

Colour scalp maps showing where on the head the error signals sit — frontocentral blue for the ERN, parietal red for the Pe. It is attractive and localises the effect, but the control (top) and meditation (bottom) maps look nearly identical at a glance, so a reader could reasonably conclude the opposite of the module's claim. Use it only as decorative context alongside Figure 1, or skip it.

researchers used EEG to measure brain responses while participants rapidly identified visual targets among multiple competing distractions (Lin et al., 2019). Compared to a control group, participants who completed a 20-minute open-monitoring meditation displayed a stronger signal associated with noticing their mistakes. A single session wasn't enough to improve actual performance on the task, but it did strengthen the neurological signal associated with catching mistakes.
Neff & Dahm, 2015 Figure 1
low
Neff & Dahm, 2015 Figure 1
Source caption

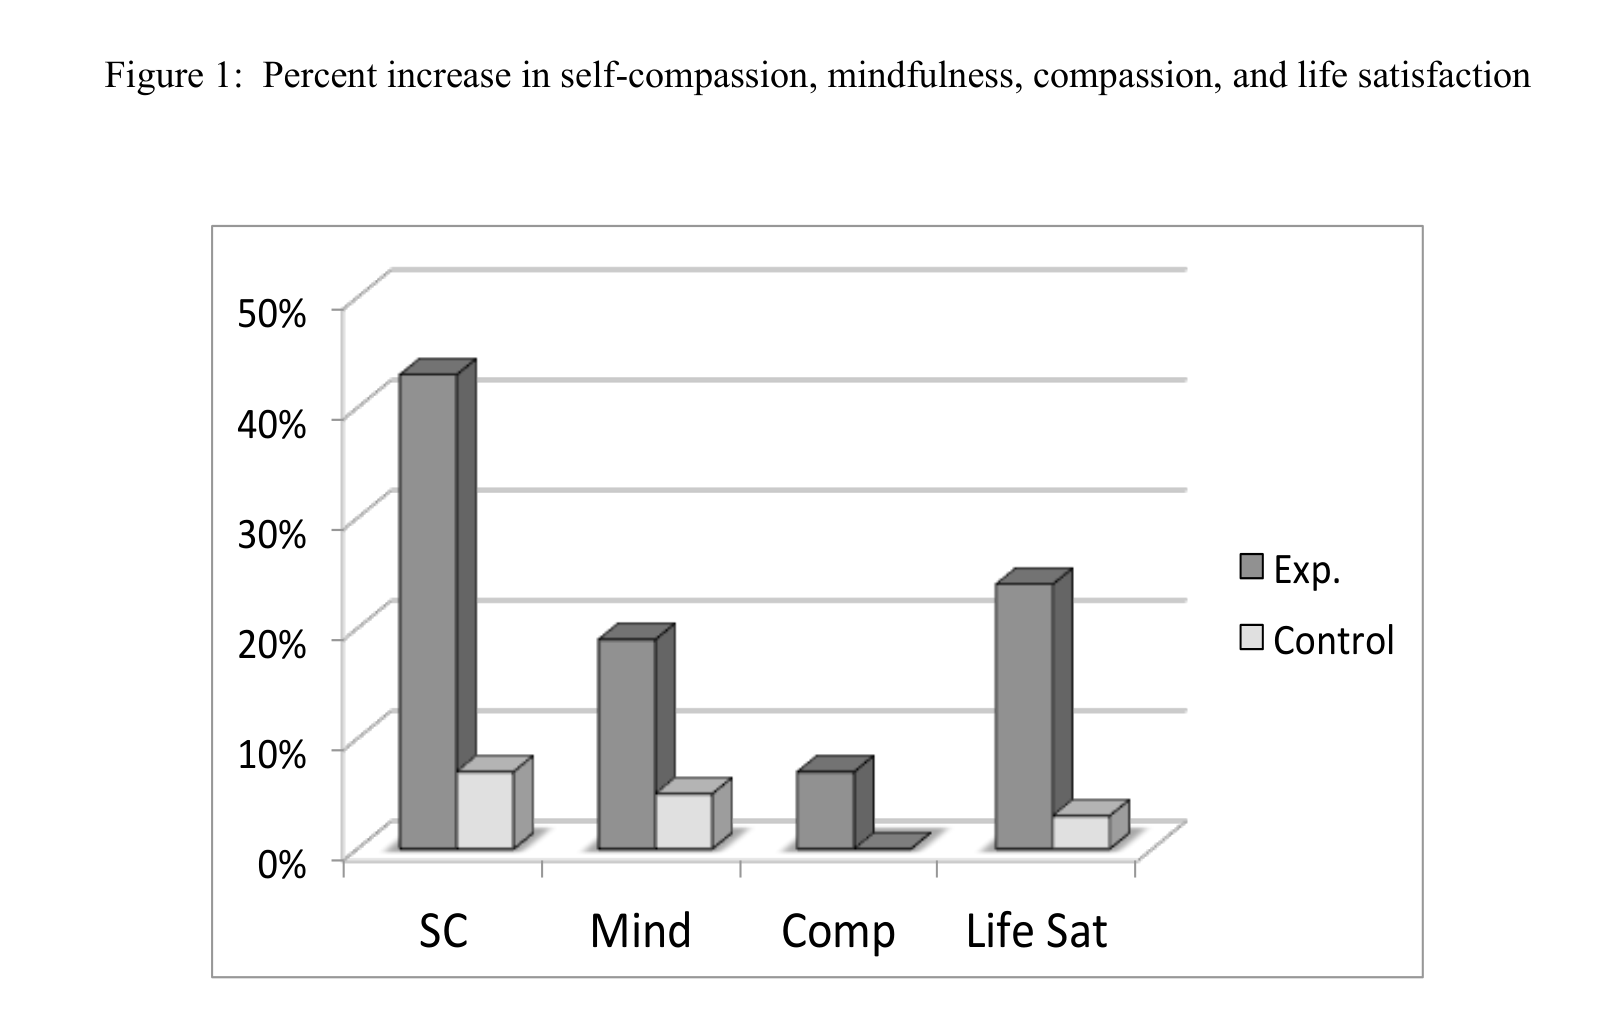
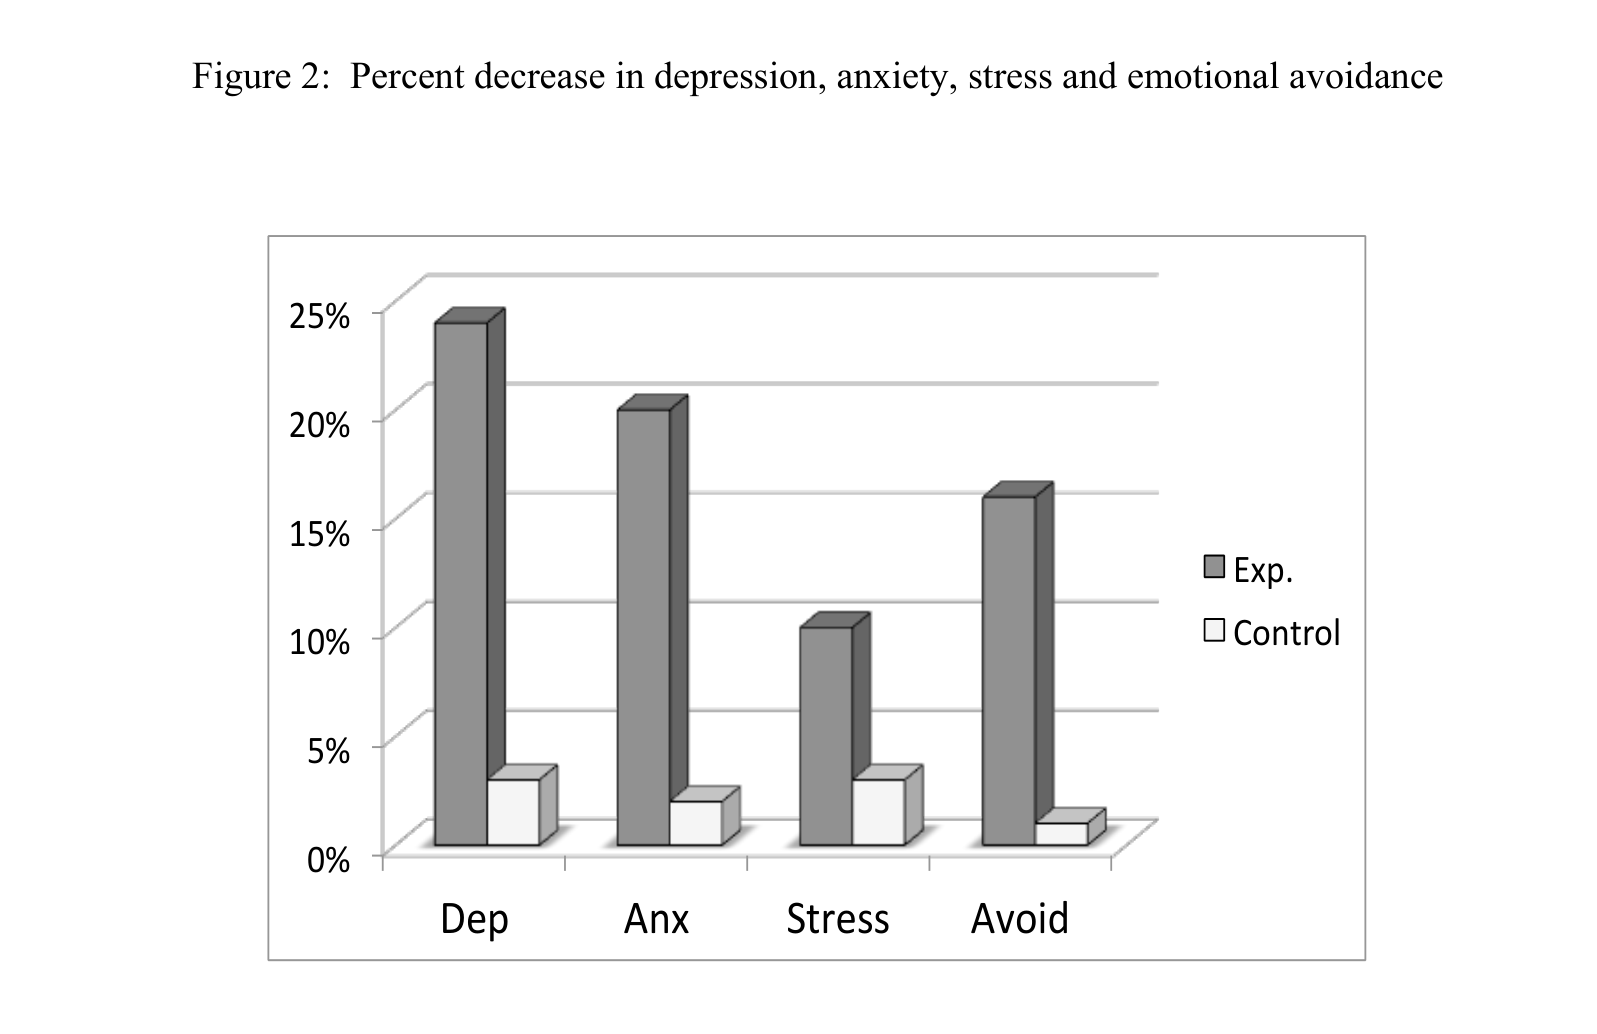
Figure 1: Percent increase in self-compassion, mindfulness, compassion, and life satisfaction

Percent increases in self-compassion, mindfulness, compassion, and life satisfaction for the Mindful Self-Compassion program versus control. It supports the chapter's broader case that self-kindness is trainable and travels with mindfulness (the pole opposite over-identification in Neff's model), but it does not measure rumination or identification with thoughts, which is what the module sentence actually claims — those points are made in the chapter's text only. The 3D Excel bar styling is also dated and will need redrawing if used.

Reviews of the self-compassion literature link self-kindness with less rumination and less identification with thoughts (Neff & Dahm, 2015).
Neff & Dahm, 2015 Figure 2
low
Neff & Dahm, 2015 Figure 2
Source caption

Figure 2: Percent decrease in depression, anxiety, stress and emotional avoidance

The companion chart: percent decreases in depression, anxiety, stress, and emotional avoidance after Mindful Self-Compassion training versus control. The emotional-avoidance bar is the closest thing in this chapter to a measure of how people relate to their own thoughts, but it is still not rumination or over-identification, so the fit to this specific sentence is loose. Same dated 3D styling caveat as Figure 1.

Reviews of the self-compassion literature link self-kindness with less rumination and less identification with thoughts (Neff & Dahm, 2015).

Relaxing mind and body0 figures

No citations in this section of the module text.

Near enemies of the relax step0 figures

No citations in this section of the module text.

The relax step as a trainable attention skill10 figures

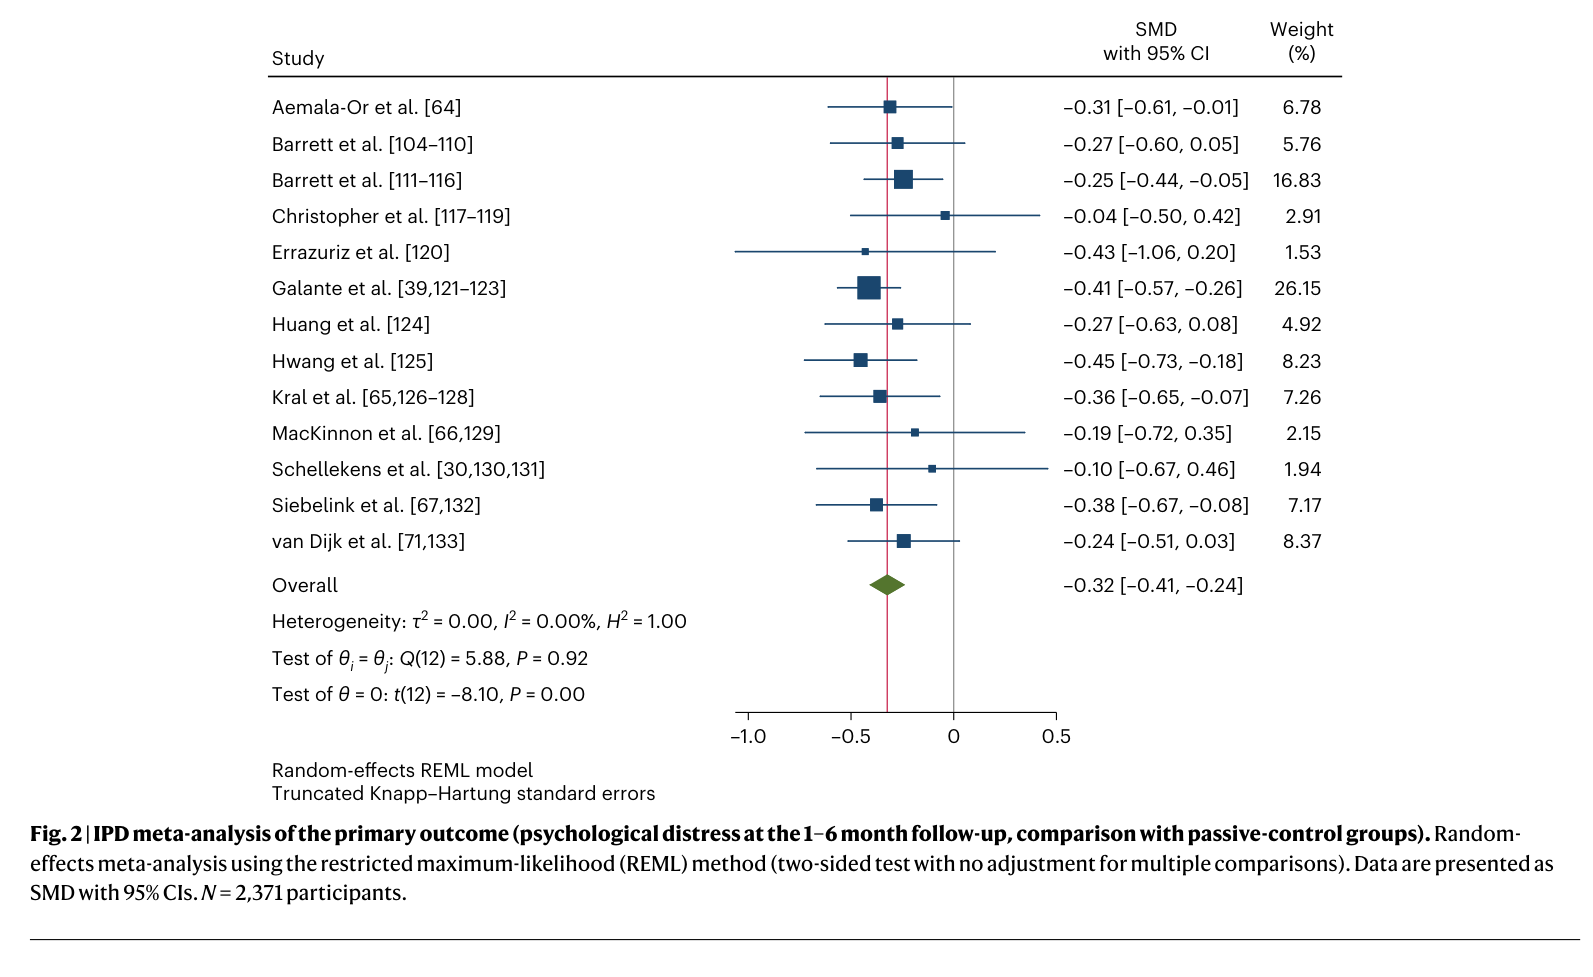
Galante et al., 2023 Fig. 2
high
Galante et al., 2023 Fig. 2
Source caption

Fig. 2 | IPD meta-analysis of the primary outcome (psychological distress at the 1–6 month follow-up, comparison with passive-control groups). Random-effects meta-analysis using the restricted maximum-likelihood (REML) method (two-sided test with no adjustment for multiple comparisons). Data are presented as SMD with 95% CIs. N = 2,371 participants.

A textbook-clean forest plot: thirteen trials, 2,371 participants, every point estimate on the favorable side of zero, and a pooled SMD of −0.32 (95% CI −0.41 to −0.24) with I² = 0%. It supports the 'reductions in psychological distress' part of the claim with the most recent and methodologically strongest design in the batch (individual participant data), and the near-zero heterogeneity makes it an unusually easy read for a non-specialist. It is partly redundant with Goyal Figure 1A — both are 'the evidence is favorable but modest' figures — so if the module wants only one, Goyal covers more outcome domains while Galante is the more current and more visually approachable. Showing both is defensible since Goyal is a breadth-of-domains summary and Galante is a depth-on-one-outcome forest plot.

systematic reviews and meta-analyses consistently report stress-related benefits from mindfulness-based programs. These include reductions in psychological distress, anxiety, and stress, along with favorable changes in cortisol, blood pressure, and heart rate (Goyal et al., 2014; Galante et al., 2023; Pascoe et al., 2017).
Goyal et al., 2014 Figure 1A
high
Goyal et al., 2014 Figure 1A
Source caption

Figure 1. Figure 1A: Summary across measurement domains of comparisons of meditation programs with non-specific active controls Figure 1B. Summary across measurement domains of comparisons of meditation programs with specific active controls

The widely reproduced summary figure from the JAMA Internal Medicine review: a combined table and forest plot giving, for each outcome domain (anxiety, depression, stress/distress, negative affect, quality of life, pain and others), the number of trials, total N, direction and magnitude of effect, and a GRADE strength-of-evidence rating, all against a 'favors meditation / favors control' axis. It is the best single figure in the batch for the module's 'reviews consistently report' sentence because it shows breadth and calibrated confidence at the same time — moderate evidence for anxiety, depression and pain; low or insufficient elsewhere. Two caveats for the authors: the caption text sits at the foot of the page rather than beneath the panel, so it is supplied here verbatim rather than inside the crop, and panel 1B (comparisons against specific active controls, almost all rated 'insufficient') was deliberately excluded; include it only if the module wants to make the point that meditation has not been shown superior to other active treatments.

systematic reviews and meta-analyses consistently report stress-related benefits from mindfulness-based programs. These include reductions in psychological distress, anxiety, and stress, along with favorable changes in cortisol, blood pressure, and heart rate (Goyal et al., 2014; Galante et al., 2023; Pascoe et al., 2017).
Taren et al., 2015 Fig. 2
high
Taren et al., 2015 Fig. 2
Source caption

Fig. 2. Discovery study (a, top left panel) Greater self-reported perceived stress on the PSS (item average) is associated with greater rsFC between right amygdala and subgenual ACC (P < 0.001). (a, top right panel) Scatterplot between perceived stress and right amygdala-sgACC rsFC parameter estimates (n = 130, R = 0.15). (b, bottom left panel) Greater self-reported perceived stress on the PSS (item average) is associated with greater rsFC between left amygdala and ACC (P < 0.001). (b, bottom right panel) Scatterplot between perceived stress and left amygdala-sgACC rsFC parameter estimates (n = 130, R = 0.101).

Supports the first half of the claim. Sagittal brain slices with the subgenual ACC cluster highlighted in red, each paired with a scatterplot of Perceived Stress Scale score against amygdala-sgACC connectivity in the n = 130 discovery sample. A clinician sees immediately both where the effect is in the brain and that the relationship is a positive but modest linear trend. The brain-plus-scatter pairing is exactly the kind of anchor the module needs, and the visible scatter keeps the reader honest about effect size (R ≈ 0.10-0.15).

higher perceived stress has been associated with stronger resting connectivity between the amygdala and other stress-related brain regions. In a randomized trial, a three-day intensive mindfulness program reduced this functional coupling (Taren et al., 2015).
Taren et al., 2015 Fig. 3
high
Taren et al., 2015 Fig. 3
Source caption

Fig. 3. Mindfulness Meditation Training RCT. The left panel depicts the region of sgACC that showed decreased rsFC with right amygdala from before to after mindfulness meditation training (HEM) relative to relaxation training (HER) (P < 0.05, corrected for multiple comparisons). The right panel depicts the mean percent signal change for subgenual ACC cluster for the mindfulness (HEM) and relaxation (HER) training groups at each of the two time points (pre- and post-intervention). Error bars depict ± 1 standard error. Parameter estimates were extracted in SPM8 and plotted in a random effects mixed model conducted in SPSS.

This is the randomized-trial figure that carries the second half of the claim. The right panel is the group x time interaction in its simplest possible form: four bars in which only Post-HEM (the 3-day mindfulness retreat arm) drops below zero while the matched relaxation-training arm stays positive. That contrast is readable in well under twenty seconds and makes the point that the effect is specific to the mindfulness component rather than to resting at a retreat. The left panel gives the anatomical location. This is the single best figure in the batch for this citation.

higher perceived stress has been associated with stronger resting connectivity between the amygdala and other stress-related brain regions. In a randomized trial, a three-day intensive mindfulness program reduced this functional coupling (Taren et al., 2015).
Wolfe et al., 2024 Table 2
high
Wolfe et al., 2024 Table 2
Source caption

TABLE 2. Heart Rate Variability Change From Baseline Compared With Mindfulness Exercisesᵃ ᵃn = 13 participants. ᵇHeart rate variability metrics in gray are consistent with parasympathetic activation (relaxation). ᶜContinuous long-term beat-to-beat interval variability sd 2 instantaneous beat-to-beat interval variability (sd 1). Boldface values are statistically significant findings.

This is the paper's core result table: five HRV metrics (RMSSD, HF normalized, parasympathetic nervous system index, SD2/SD1 ratio, and stress index) measured at baseline and during each of three brief practices (grounding, deep breathing, body scan), with p values against baseline. It is the single clearest evidence for the module's claim, showing that short relaxation exercises shifted clinicians toward parasympathetic predominance and lowered the composite stress index. It is well designed, self-explanatory to a healthcare reader, and honest about the small sample (n = 13) in its own footnote. Note that deep breathing actually lowered HF, so the table is not uniformly positive, which is a useful nuance if the module wants it.

Evidence for this shift can be seen in a small study of pediatric nurses, nurse practitioners, and physicians. Brief relaxation practices were associated with lower self-reported stress and increased heart-rate variability, which is a physiological measure of improved parasympathetic function (Wolfe et al., 2024).
Khir et al., 2024 Figure 3
medium
Khir et al., 2024 Figure 3
Source caption

Figure 3 The Efficacy of PMR on Stress, Anxiety and Depression.

Three pie charts showing the proportion of standalone PMR studies reporting a significant reduction in stress (93%, 14 of 15), anxiety (82%, 14 of 17) and depression (87%, 7 of 8). It maps directly onto the first half of the module sentence and is legible in about five seconds. Rated medium, not high, because it is vote counting rather than pooled effect sizes — it says how many studies found an effect, not how large the effect was — so it overstates certainty if presented without comment. Pair it with Figure 4 or caption it carefully.

progressive muscle relaxation... examined in a systematic review of 46 studies involving more than 3000 adults, which found the practice to be generally associated with reduced stress, anxiety, and depression (Khir et al., 2024). These benefits were often stronger when it was combined with other meditative skills.
Khir et al., 2024 Figure 4
medium
Khir et al., 2024 Figure 4
Source caption

Figure 4 The Efficacy of PMR combined with other interventions on Stress, Anxiety and Depression.

The companion chart for PMR combined with other interventions (health education, music therapy, other relaxation techniques, deep breathing): 100% of studies reported reduced stress versus 93% for standalone PMR. This is the only figure in the paper that speaks to the module's second sentence about benefits being stronger in combination, so it earns its place alongside Figure 3 and the two should be shown as a pair. Same vote-counting caveat as Figure 3, and note honestly that the combined-intervention depression result is actually weaker (67% vs 87%), so the 'stronger in combination' claim holds for stress but not across all outcomes.

progressive muscle relaxation... examined in a systematic review of 46 studies involving more than 3000 adults, which found the practice to be generally associated with reduced stress, anxiety, and depression (Khir et al., 2024). These benefits were often stronger when it was combined with other meditative skills.
Pascoe et al., 2017 Fig 2
medium
Pascoe et al., 2017 Fig 2
Source caption

Fig 2

The cortisol forest plot, pooled by time of day: waking −1.51 (−2.83, −0.19), afternoon −0.60 (−1.13, −0.06) and evening −0.88 (−1.75, −0.01) all favor the intervention, while mid-morning and diurnal slope do not. This is the only figure in the batch that evidences the 'favorable changes in cortisol' clause, so it is the non-redundant contribution Pascoe makes alongside Goyal and Galante. Rated medium: the PDF is an accepted manuscript, so the figure is a low-resolution raster with no descriptive caption beyond the bare label 'Fig 2', it is dense enough to push the twenty-second test, and most contributing trials are yoga rather than MBSR — the module should say 'yoga and mindfulness-based programs' if it cites this figure directly.

systematic reviews and meta-analyses consistently report stress-related benefits from mindfulness-based programs. These include reductions in psychological distress, anxiety, and stress, along with favorable changes in cortisol, blood pressure, and heart rate (Goyal et al., 2014; Galante et al., 2023; Pascoe et al., 2017).
Wolfe et al., 2024 Figure 2
medium
Wolfe et al., 2024 Figure 2
Source caption

Figure 2. Poincarè plots demonstrating parasympathetic predominance (relaxation) during body scan exercise. A, Participant baseline torpedo shaped measurement consistent with sympathetic overdrive. B, Same participant demonstrating parasympathetic predominance, relaxation, during the body scan exercise. X-axis RRn (ms): RR interval, y-axis: RRn + 1 (ms): subsequent RR interval.

Two Poincarè plots from the same clinician, baseline versus body scan, where the narrow cigar-shaped cloud visibly opens into a broad ellipse. It is a strong visual anchor for what 'increased heart-rate variability' actually means, turning an abstract metric into a shape a reader can see change in a few seconds. Rated medium rather than high because it is a single participant, illustrative rather than inferential, and Poincarè plots are unfamiliar to most clinicians — it would need a one-line gloss in the module ('wider cloud = more beat-to-beat variability = more parasympathetic tone').

Evidence for this shift can be seen in a small study of pediatric nurses, nurse practitioners, and physicians. Brief relaxation practices were associated with lower self-reported stress and increased heart-rate variability, which is a physiological measure of improved parasympathetic function (Wolfe et al., 2024).
Pascoe et al., 2017 Fig 4
low
Pascoe et al., 2017 Fig 4
Source caption

Fig 4

The blood-pressure forest plot, with pooled estimates for resting diastolic BP −3.66 mmHg (−5.84, −1.48) and resting systolic BP −5.17 mmHg (−8.31, −2.03), each additionally split into MBSR and non-MBSR subgroups — the MBSR-specific stratification is the part that matters for this module. Included because blood pressure is named explicitly in the claim and no other paper in the batch covers it. Rated low for reproduction: at roughly sixty rows on a single low-resolution accepted-manuscript page it is far too dense for a textbook module, and the labels are only marginally legible even at high crop resolution. Recommendation is to quote the two pooled mmHg figures in the module text rather than reproduce this figure; ship it only if the authors want a visual and are willing to redraw it as a small summary graphic.

systematic reviews and meta-analyses consistently report stress-related benefits from mindfulness-based programs. These include reductions in psychological distress, anxiety, and stress, along with favorable changes in cortisol, blood pressure, and heart rate (Goyal et al., 2014; Galante et al., 2023; Pascoe et al., 2017).
Benson et al., 1974
none
No figure

PDF is not present in /Users/corbin/Downloads/20260802-Module-2-PDFs/. Verified by directory listing and by filename search for 'benson' and '1974'; no match. No figure could be harvested for this citation.

PDF not in the folder
In the 1970s, Benson and colleagues first studied meditation not as a religious or contemplative practice but as a measurable physiological process... a wakeful state of lower metabolism, along with reductions in oxygen consumption, carbon dioxide output, breathing rate, and blood pressure (Wallace et al., 1971; Benson et al., 1974).
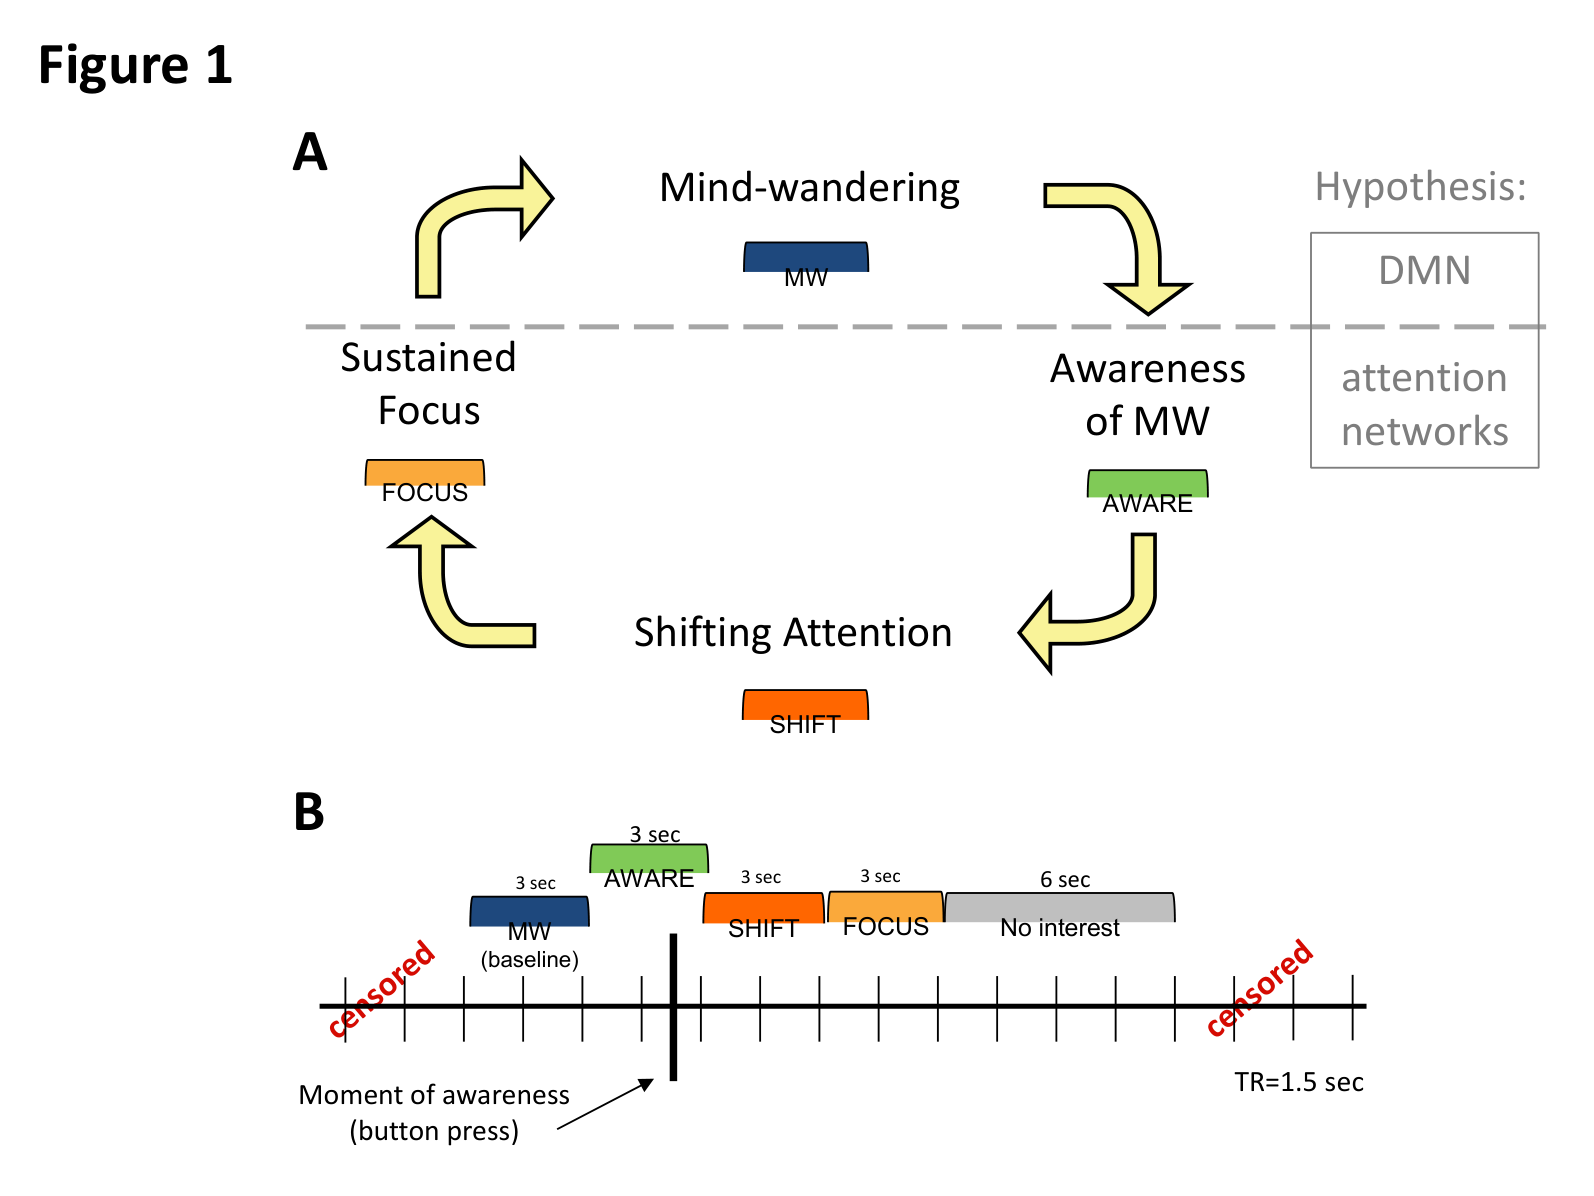
Wallace et al., 1971
none
No figure

PDF is not present in /Users/corbin/Downloads/20260802-Module-2-PDFs/. Directory listing and a filename search for 'wallace', 'benson', '1971' and '1974' returned no match, so no figure could be harvested. Worth sourcing: the Wallace, Benson & Wilson 1971 Am J Physiol paper contains the classic time-series traces of oxygen consumption, CO2 elimination and respiratory rate across pre-meditation / meditation / post-meditation periods, which would illustrate this exact claim better than any modern substitute.

PDF not in the folder
In the 1970s, Benson and colleagues first studied meditation not as a religious or contemplative practice but as a measurable physiological process... a wakeful state of lower metabolism, along with reductions in oxygen consumption, carbon dioxide output, breathing rate, and blood pressure (Wallace et al., 1971; Benson et al., 1974).

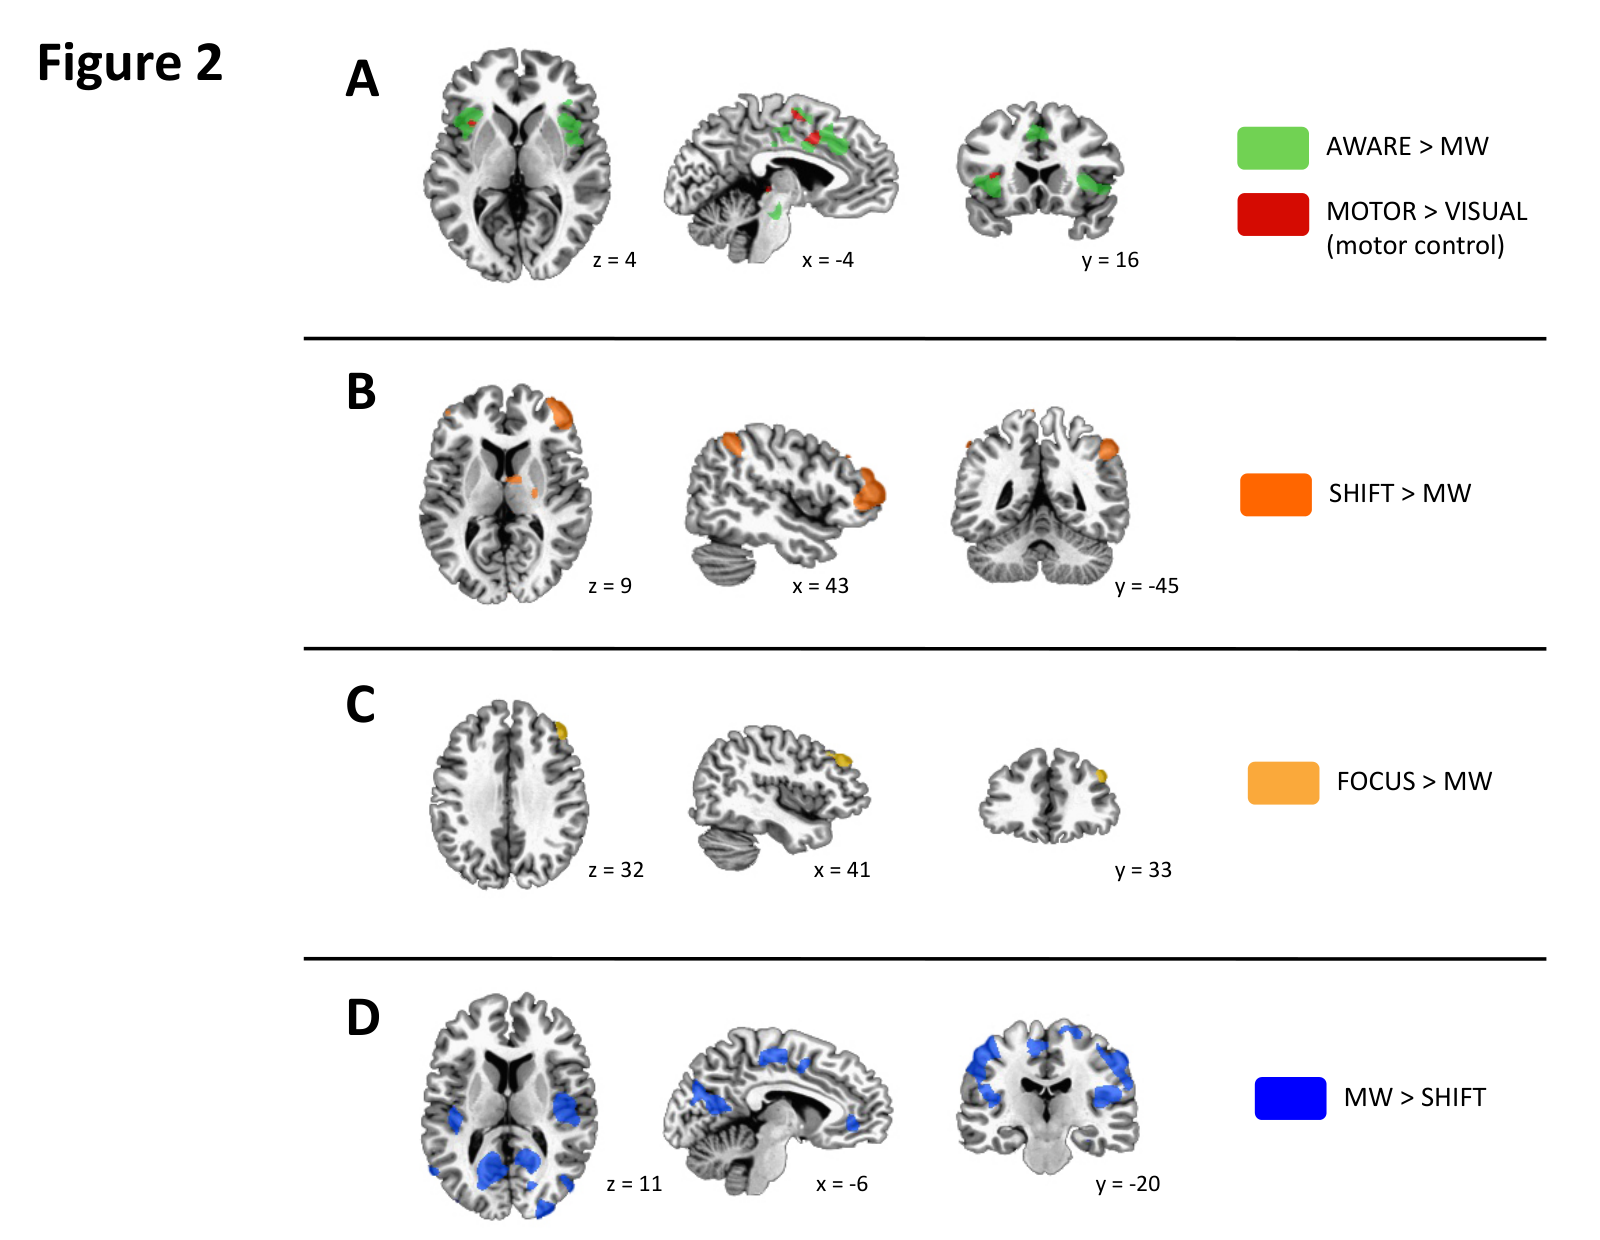
Allowing and noticing relief0 figures

No citations in this section of the module text.

Near enemies of relief3 figures

Ekman et al., 1990 Figure 1
high
Ekman et al., 1990 Figure 1
Source caption

Figure 1. Spontaneous smile of enjoyment according to Duchenne (1862/in press). (Compare the cheeks and the skin gathered in around the eyes in this figure with Figure 2.)

Duchenne's original 1862 photograph of a spontaneous smile of enjoyment: the corners of the mouth are up, but the cheeks are also raised and the skin is visibly gathered in around the eyes. This is the 'genuine' half of the exact contrast the module describes in words. Its caption explicitly instructs the reader to compare cheeks and eye-skin with Figure 2, so the two photographs are designed to be shown as a pair. Note the image is a 19th-century clinical photograph of an elderly patient and reads as somewhat startling out of context, so it needs a sentence of framing.

Fifth, there's **false smiling.** Researchers who study facial expression have long distinguished between genuine smiles and artificial ones performed without actual enjoyment. A false smile lifts the corners of the mouth, but it does not spread naturally through the rest of the face. The cheeks do not rise naturally, and the eyes do not soften or gently narrow.
Ekman et al., 1990 Figure 2
high
Ekman et al., 1990 Figure 2
Source caption

Figure 2. The zygomatic major muscle stimulated to produce a smile (Duchenne, 1862/in press).

The same man with his zygomaticus major electrically stimulated by Duchenne's electrodes, producing a mouth-only smile. The mouth corners are pulled up but the eyes stay wide and unsoftened and the cheeks are not lifted — literally a smile with the enjoyment removed. Shown beside Figure 1 this is the single most direct visual for the module's sentence that a false smile 'lifts the corners of the mouth, but it does not spread naturally through the rest of the face.' The visible wires make the manipulation self-evident without any statistics.

Fifth, there's **false smiling.** Researchers who study facial expression have long distinguished between genuine smiles and artificial ones performed without actual enjoyment. A false smile lifts the corners of the mouth, but it does not spread naturally through the rest of the face. The cheeks do not rise naturally, and the eyes do not soften or gently narrow.
Soussignan, 2002 Figure 1
high
Soussignan, 2002 Figure 1
Source caption

Figure 1. Illustration of the technique used to induce distinct facial configurations: (a) jaw dropping (control group), (b) lips pressing (lips pressing group), (c) lips corner pulling (non-Duchenne smile group), and (d) lips corner pulling and cheeks raising (Duchenne smile group).

Four photographs of pencil-held facial configurations; panels (c) and (d) are the modern, non-clinical version of the Duchenne contrast — (c) is lip-corner pulling only, (d) adds cheek raising, and the difference around the eyes is plainly visible between the two. This is a gentler and more relatable alternative to the 19th-century Duchenne plates if the authors want only one photographic figure. Panels (a) and (b) are experimental controls that the module does not discuss, so the authors may prefer to crop to (c) and (d) alone.

Fifth, there's **false smiling.** Researchers who study facial expression have long distinguished between genuine smiles and artificial ones performed without actual enjoyment. A false smile lifts the corners of the mouth, but it does not spread naturally through the rest of the face. The cheeks do not rise naturally, and the eyes do not soften or gently narrow.
Frank et al., 1993
none
No figure

This paper contains no figures at all — no photographs of smiles, no muscle diagrams, only four numeric tables of durations and judgment accuracy. It therefore contributes nothing visual to the false-smiling passage, which is fundamentally about what the two smiles look like. The photographic support for this passage comes from Ekman et al. (1990) Figures 1-2 and Soussignan (2002) Figure 1; Frank's tables are filed under the relief-step section instead, where they match the timing and recognizability claims.

Fifth, there's **false smiling.** Researchers who study facial expression have long distinguished between genuine smiles and artificial ones performed without actual enjoyment. A false smile lifts the corners of the mouth, but it does not spread naturally through the rest of the face. The cheeks do not rise naturally, and the eyes do not soften or gently narrow.

The relief step as a trainable attention skill9 figures

Coles et al., 2022 Fig. 2
high
Coles et al., 2022 Fig. 2
Source caption

Fig. 2 | Effects of facial expression poses and filler tasks on self-reported happiness in each study condition. Self-reported happiness (1 = 'not at all' to 7 = 'an extreme amount') after the participants posed happy facial expressions, posed neutral facial expressions or completed filler tasks. The panel columns indicate whether the participants completed the facial mimicry, voluntary facial action or pen-in-mouth task. The panel rows indicate whether positive images were absent or present during the facial pose tasks. The grey points represent jittered participant observations. The blue error bars represent mean ± 1 standard error. Condition-specific sample sizes, means and standard deviations are reported.

The study's main result, and it doubles as the figure showing the three facial-posing techniques the brief asked for — facial mimicry, voluntary facial action and pen-in-mouth are the three panel columns. Happy poses beat neutral poses in the two techniques that involve deliberately forming an expression, both with and without positive images present, supporting 'initiates and amplifies'. Important honesty note for the authors: the pen-in-mouth column shows essentially no effect, so the module's word 'reliably' is stronger than this figure supports and the caption should acknowledge that the effect depends on the posing method. There is no forest plot by site in this paper; Fig. 1 is only a world map of country sample sizes and is not worth reproducing.

A large multi-laboratory study of nearly 4,000 participants across 19 countries found that voluntary and genuine smiling reliably both initiates and amplifies feelings of happiness (Coles et al., 2022).
Ekman et al., 1990 Table 1
high
Ekman et al., 1990 Table 1
Source caption

Table 1 Correlations Between Type of Smile and Self-Reported Emotions (N = 34) * p < .001, one-tailed test. ** p < .01, two-tailed test. *** p < .05, two-tailed test.

Two rows that make the claim almost self-reading: Duchenne smiles correlate .703 with amusement, .594 with happiness, .387 with excitement and .401 with interest — all significant — while other smiles correlate .135, .180, .080 and .189, none significant. A reader scanning two rows sees immediately that only the genuine smile tracks reported enjoyment. This is the cleanest quantitative support for the 'more closely associated with enjoyment' wording anywhere in this batch.

In classic studies, genuine smiles were more closely associated with enjoyment and positive emotion than false, mouth-only smiles (Ekman et al., 1990, Soussignan, 2002).
Fredrickson & Levenson, 1998 FIG. 3
high
Fredrickson & Levenson, 1998 FIG. 3
Source caption

FIG. 3. Mean time to achieve cardiovascular recovery in Study 1. Groups are identified by the emotion featured in the second film viewed. Error bars represent standard errors of the means.

A four-bar chart of seconds-to-cardiovascular-recovery after a fear film, by the emotion of the film shown next: contentment ~17s and amusement ~19s versus neutral ~40s and sadness ~61s. This is the canonical 'undoing effect' graph and it makes the module's claim legible in a glance — contentment, the state the practice cultivates, is the fastest condition, and the ordering is monotone in the direction the text asserts. Requires no statistical training to read.

cultivating states such as contentment and warmth can help the cardiovascular system return to baseline more quickly after stress exposure. Positive emotion appears to reverse some of the residual arousal that stress leaves behind (Fredrickson & Levenson, 1998; Fredrickson et al., 2000).
Fredrickson et al., 2000 Fig. 1
high
Fredrickson et al., 2000 Fig. 1
Source caption

Fig. 1. Mean duration of cardiovascular reactivity by Film Group in Sample 1 of Study 1. Error bars represent standard errors of the means.

The 1998 result replicated in a larger sample: mean duration of cardiovascular reactivity is ~22-23s for the contentment and amusement groups versus ~35s neutral and ~42s sadness. Because it is the same bar-chart form as the 1998 figure, the two can be shown side by side to make the replication visible, or the authors can pick one. Note the effect is smaller here than in 1998, which is worth not over-claiming in the caption.

cultivating states such as contentment and warmth can help the cardiovascular system return to baseline more quickly after stress exposure. Positive emotion appears to reverse some of the residual arousal that stress leaves behind (Fredrickson & Levenson, 1998; Fredrickson et al., 2000).
Kraft & Pressman, 2012 Fig. 1
high
Kraft & Pressman, 2012 Fig. 1
Source caption

Fig. 1. Examples of photographs shown to participants in the neutral group (left), standard-smile group (middle), and Duchenne-smile group (right) to help them form the appropriate expressions.

The chopsticks manipulation: three photographs of the same woman holding chopsticks in a neutral position, a standard (mouth-only) smile, and a Duchenne smile with the eyes engaged. It makes an otherwise odd-sounding method instantly concrete, and it independently reinforces the near-enemies distinction using a clean modern photo instead of the 19th-century plates. Pair it with Fig. 2 so the reader sees the manipulation and then its physiological consequence.

During laboratory stressors, participants who held a smiling expression showed faster heart-rate recovery afterward than those who held a neutral expression (Kraft & Pressman, 2012).
Kraft & Pressman, 2012 Fig. 2
high
Kraft & Pressman, 2012 Fig. 2
Source caption

Fig. 2. Mean heart rate (in beats per minute) during the recovery period following the star-tracer task as a function of measurement occasion and condition. Results are shown separately for (a) the three facial-expression groups and (b) the aware and nonaware subgroups of the two smiling groups (collapsed across groups). The analysis controlled for sex, condition adherence, baseline perceived stress, perceived task difficulty, task stress, and facial-muscle fatigue. Error bars represent standard errors.

Panel (a) is exactly the module's claim: heart rate across the 6-minute recovery window after the star-tracer stressor, with the neutral group settling near 70 bpm while standard smilers settle near 67 and Duchenne smilers near 64, and the three curves clearly separated with error bars. Panel (b) breaks the smilers into aware and nonaware subgroups, a nuance the module does not discuss — if space is tight the authors can crop to panel (a) alone. Fig. 3 in the same paper repeats this for the cold-pressor stressor and is redundant here.

During laboratory stressors, participants who held a smiling expression showed faster heart-rate recovery afterward than those who held a neutral expression (Kraft & Pressman, 2012).
Soussignan, 2002 Figure 2
high
Soussignan, 2002 Figure 2
Source caption

Figure 2. Self-reports of emotional reaction as a function of the type of facial configuration while participants were shown videoclips. CG = control group; LPG = lips pressing group; n-DSG = non-Duchenne smile group; DSG = Duchenne smile group.

A four-bar chart of self-reported affective reaction by facial configuration. The Duchenne smile group reports roughly twice the positive reaction of the non-Duchenne (mouth-only) group, which in turn barely differs from the two non-smiling controls. That is precisely the module's 'genuine versus false, mouth-only' comparison rendered as one readable graph, and it pairs naturally with Soussignan Figure 1, whose panels (c) and (d) are the very configurations labelled n-DSG and DSG here.

In classic studies, genuine smiles were more closely associated with enjoyment and positive emotion than false, mouth-only smiles (Ekman et al., 1990, Soussignan, 2002).
Frank et al., 1993 Table 1
medium
Frank et al., 1993 Table 1
Source caption

Table 1 Overall Duration of Smiles by Situation (in Seconds)

Duration of smiles with versus without the Duchenne marker, in social and solitary situations. Duchenne-marked smiles are shorter (pooled M = 4.75s vs 7.09s) and, more to the point, far less variable (pooled variance 20.01 vs 93.43) — that clustering around a typical duration is exactly the paper's operationalization of the 'smoother, more natural timing' the module claims. Honest caveat: the payload is in the variance row, which a reader has to be told to look at, so this needs a one-line gloss to land in under 20 seconds. It is the best available support since the paper has no figures.

The genuine smile we've been discussing is referred to as a Duchenne smile in research contexts, after the nineteenth-century neurologist who first studied the facial muscles involved in smiling (Frank et al., 1993). Smiles of enjoyment also tend to have a smoother, more natural timing, and are more recognizable to others.
Frank et al., 1993 Table 2
low
Frank et al., 1993 Table 2
Source caption

Table 2 Proportion of Correct Judgments by Type of Judgment and by Whether Both the Enjoyment and Nonenjoyment Smile had the Duration Marker

Observers' accuracy at telling enjoyment from nonenjoyment smiles: overall .56 judging single smiles and .74 judging smile pairs, against a chance rate of .50. This is the only direct evidence in the harvest for the 'more recognizable to others' half of the claim. It is filed low because the .50 chance baseline is stated in the body text and not in the table, and the M/SD scaffolding makes the reader work; if the authors want it, they should reproduce only the 'Overall accuracy' row with chance noted in the caption.

The genuine smile we've been discussing is referred to as a Duchenne smile in research contexts, after the nineteenth-century neurologist who first studied the facial muscles involved in smiling (Frank et al., 1993). Smiles of enjoyment also tend to have a smoother, more natural timing, and are more recognizable to others.

Returning to kindness and warmth0 figures

No citations in this section of the module text.

Near enemies of return0 figures

No citations in this section of the module text.

The return step as a trainable attention skill4 figures

Slagter et al., 2007 Figure 1
high
Slagter et al., 2007 Figure 1
Source caption

Figure 1. Attentional-Blink Task On every trial, between 15 and 19 items were presented at the center of the screen, preceded by a 1,780-ms fixation cross. Most of the items were letters, presented for 50 ms each and followed by a 34-ms blank. On T2-present trials, there were two target numbers (T1 and T2) among the items, which participants had to detect and report at the end of the trial. The temporal distance between T1 and T2 could be short (336 ms) or long (672 ms). doi:10.1371/journal.pbio.0050138.g001

A clean isometric schematic of the rapid serial visual presentation stream: a rising staircase of letter frames with the two digit targets T1 and T2 arrowed and labelled, the 50 + 34 ms frame duration marked, and the two end-of-trial probe questions shown. The module explains the attentional blink paradigm in prose, and a reader who has never seen an RSVP task will grasp it far faster from this one image than from the sentence. This is the diagram that makes the rest of the attentional-blink discussion (including the Wang et al. figure) interpretable.

The attentional blink is a brief period in which a second event is less likely to be noticed when it appears soon after the first... Meditation training appears to decrease this attentional blink. In one study, participants completed three months of intensive meditation training before performing an attentional blink task. Compared to controls, they became significantly better at detecting rapidly presented visual targets. EEG recordings also suggested that their attentional resources were being allocated more efficiently (Slagter et al., 2007).
Slagter et al., 2007 Figure 2
high
Slagter et al., 2007 Figure 2
Source caption

Figure 2. Effects of Intensive Mental Training on the Attentional Blink (A) T2 accuracy at time 1 (black bars) and the improvement (red bars) or deterioration (blue bars) in T2 accuracy at time 2, for each participant, separately for the short and long T1–T2 interval. (B) Average T2 accuracy (plus standard error) for each session, T1–T2 interval, and group (at-chance participants excluded). Note that both groups showed an attentional blink at time 1: lower T2 accuracy at short- compared to long-interval trials. Note further that, as predicted, the practitioner group (Pract) showed a significantly larger reduction in attentional-blink size over time than the novice group (Nov). doi:10.1371/journal.pbio.0050138.g002

The pre/post T2-accuracy result for the 3-month retreat. Panel B is the 20-second takeaway and carries the module's claim on its own: at the short T1–T2 interval (inside the blink window) practitioners jump from ~61% to ~81% T2 accuracy between Time 1 and Time 2, while novices move only ~61% to ~70%; at the long interval both groups barely move, showing the gain is specific to the blink window rather than general practice. Panel A is a per-participant bar chart that is denser and needs the red/blue legend to read, so if the authors want maximum clarity they may prefer to reproduce panel B alone and label it 'Figure 2B'. I cropped the complete figure with its full caption so the choice stays with them.

Meditation training appears to decrease this attentional blink. In one study, participants completed three months of intensive meditation training before performing an attentional blink task. Compared to controls, they became significantly better at detecting rapidly presented visual targets (Slagter et al., 2007).
Wang et al., 2022 Fig. 3
high
Wang et al., 2022 Fig. 3
Source caption

Fig. 3 Effects of mindfulness training on T1 and T2 accuracy in the attentional blink task

Four accuracy-by-lag panels with pre/post curves for the mindfulness and waitlist-control groups. Panel b is the money panel: the characteristic attentional-blink dip at lag2–lag3 is unmistakable, and the solid red post-mindfulness curve sits clearly above the dashed red pre-mindfulness curve across the recovery lags while the two blue control curves stay close together. It replicates the Slagter result in an ordinary 8-week program rather than a 3-month retreat, which is the point the module is making, and the shared lag axis makes it visually comparable to the Slagter figure. Caveat: the figure shows the accuracy improvement only; the correlation with FFMQ non-reactivity that the module's second clause cites is reported in the paper's Table 7, not here.

A similar pattern was observed in a randomized waitlist-controlled study of an eight-week mindfulness program. Participants showed improved ability to detect rapidly presented targets in sequence, and these improvements were associated with increases in non-reactivity to thoughts and emotions (Wang et al., 2022).
Zainal & Newman, 2024 Figure 2
high
Zainal & Newman, 2024 Figure 2
Source caption

Figure 2. Forest plot of MBIs on global cognition and unique cognitive subdomain outcomes compared to active controls. Note: MBI = mindfulness-based intervention; WM = working memory.

A single forest plot ranking all 16 cognitive outcomes by Hedge's g against active controls, with CIs and p-values printed alongside. It directly displays the three constructs the module names: Global Cognition (g = 0.21), Executive Attention (g = 0.19), Shifting Accuracy (g = 0.20), and Sustained Attention Accuracy (g = 0.21), all p < .01. The 'MBIs harmful / MBIs protective' axis labels make the direction legible at a glance to a non-specialist, and the visible spread between significant and non-significant domains conveys honestly that mindfulness helps attention specifically rather than cognition uniformly. Note the plot compares MBIs to ACTIVE controls, so these are conservative estimates; it does not itself show the stress/anxiety/depression moderator effect, which the module's second sentence claims and which lives in the paper's supplementary moderator tables.

a meta-analysis of over one hundred randomized controlled trials found that mindfulness practice significantly improves global cognitive function, particularly executive attention abilities such as shifting attention between objects and sustaining attention over time. These improvements were especially large among individuals initially experiencing stress, anxiety, or depression (Zainal & Newman, 2024).
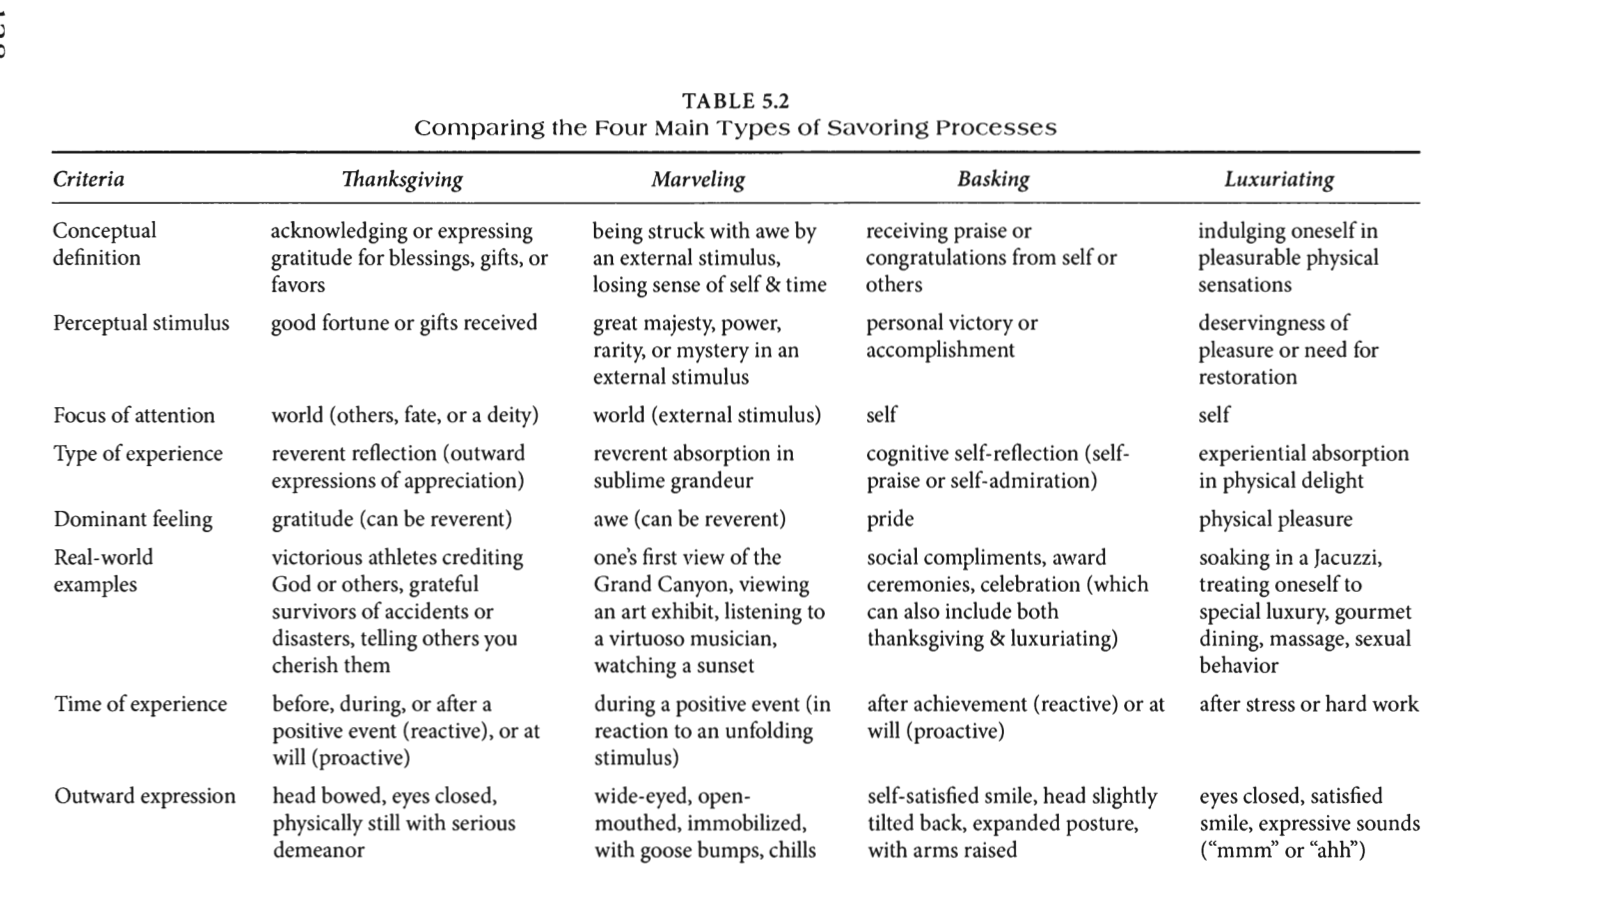
Reviewing lovingkindness meditation0 figures

No citations in this section of the module text.

Beginning where you are and deepening over time0 figures

No citations in this section of the module text.

The 4R’s are part of meditation0 figures

No citations in this section of the module text.

Learning to see distraction as feedback and opportunity0 figures

No citations in this section of the module text.

Enjoyment0 figures

No citations in this section of the module text.

Bringing the 4R’s Into Daily Life2 figures

Owens et al., 2020 TABLE 2
high
Owens et al., 2020 TABLE 2
Source caption

TABLE 2. ProQOL Paired-Samples t-Test for Pre- and Postintervention Measures (N = 32) Abbreviations: BO, burnout; CI, confidence interval; CS, compassion satisfaction; SD, standard deviation; STS, secondary traumatic stress.

The paper's entire outcome result in three rows: burnout fell 23.34 to 21.72 (g = -0.26, p = .011) and secondary traumatic stress fell 23.63 to 21.28 (g = -0.48, p = .005), while compassion satisfaction was unchanged (p = .96). It is a well-designed, colour-blocked table that a nurse or physician reads instantly, and it maps one-to-one onto the module's two named outcomes. The unchanged compassion-satisfaction row is worth keeping rather than trimming, since it shows the effect was specific to the distress measures. I rendered every page of this 8-page paper; page 5 holds the only two tables and there are no figures, and Table 1 is participant demographics, which the brief deprioritises.
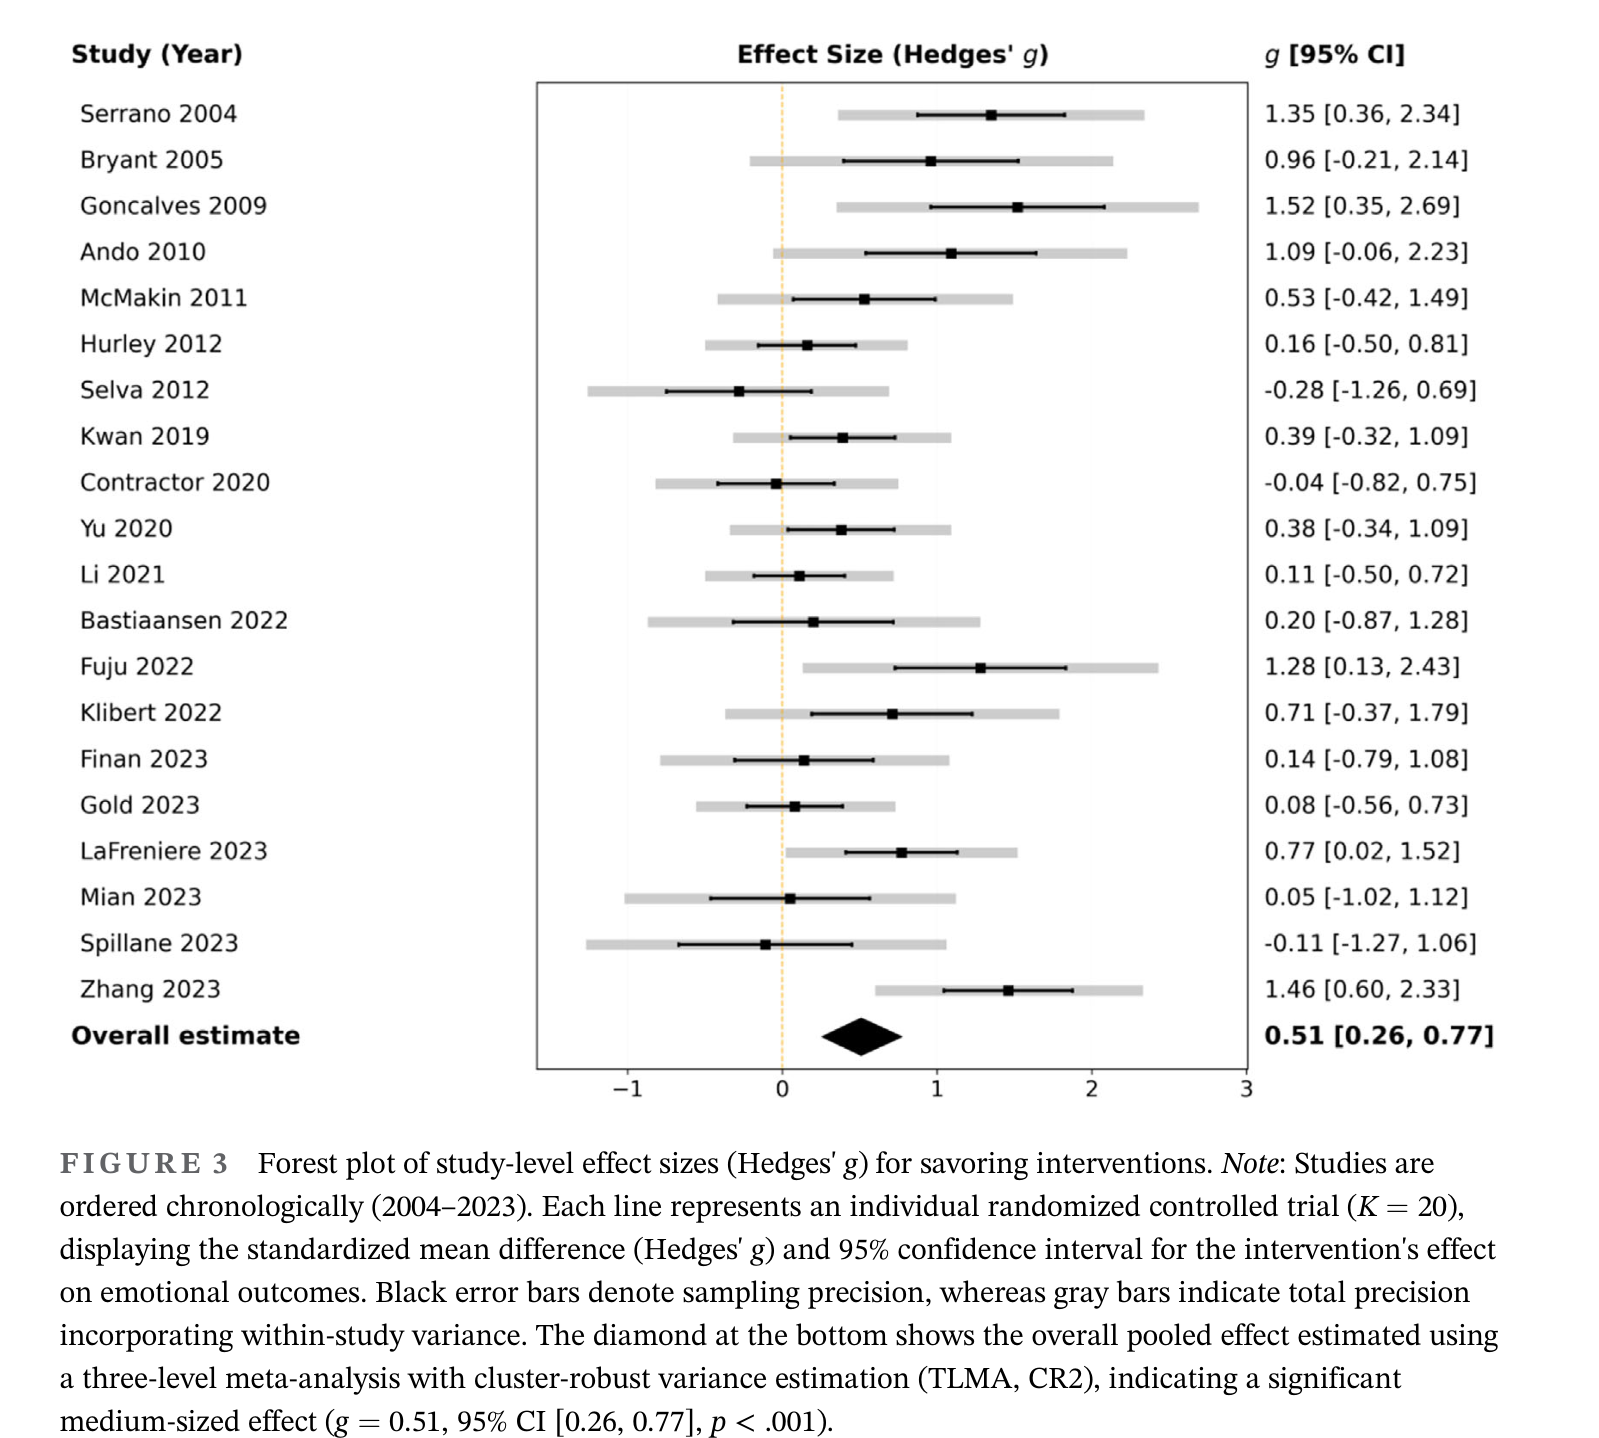
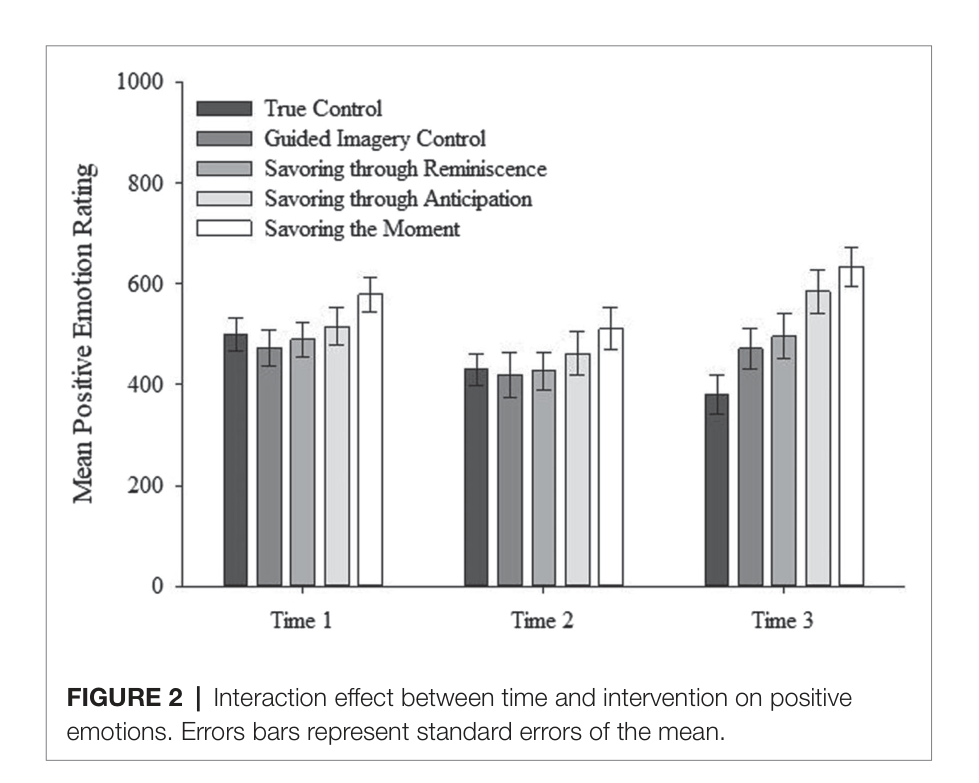
during demanding clinical shifts, engaging in a three-minute mindfulness breathing micropractice helped reduce compassion fatigue and emotional exhaustion among nurses (Owens et al., 2020).
Seppälä et al., 2014 Table 1
medium
Seppälä et al., 2014 Table 1
Source caption

Table 1 Change in Explicit Evaluative Responses After Loving-Kindness Meditation (LKM) or Neutral Imagery Induction (IMAGERY) Note. Presents change pre- to postmanipulation in explicit evaluations, which were assessed by using a 7-point Likert scale. * p < .05. ** p < .005.

CITATION MISMATCH — the module's sentence does not describe the paper it cites. `Seppälä et al. (2014) .pdf` is 'Breathing-Based Meditation Decreases Posttraumatic Stress Disorder Symptoms in U.S. Military Veterans' (J Traumatic Stress, 27, 397-405), a randomized trial of Sudarshan Kriya yoga in 21 male Iraq/Afghanistan veterans; it involves no loving-kindness meditation, no healthcare providers, and no measure of connection toward strangers, and its only figures are a CONSORT flow diagram (p. 3) and a PTSD hyperarousal plot (p. 6). The paper that actually supports the sentence is Hutcherson, Seppala & Gross (2008), 'Loving-Kindness Meditation Increases Social Connectedness' (Emotion, 8, 720-724), so I harvested from that file instead. Its Table 1 is the supporting evidence: after LKM, explicit positivity rose significantly toward the meditation target (+1.13, p < .005) and toward two novel nontarget strangers (+0.62 and +0.49, both p < .005), versus near-zero change for nontargets after the matched neutral-imagery control. Two further corrections for the authors: Hutcherson describes the exercise as a brief 7-minute, not 10-minute, induction, and participants were laboratory volunteers, not stressed healthcare providers. It is a bare numeric table rather than a graph, which is why I rate it medium rather than high; the paper contains no figures at all, only this table and a companion implicit-measure table (p. 4) reported in milliseconds of response-time bias, which is too specialist for this audience.

To address severe chronic stress and burnout among time-constrained healthcare providers, Seppala and colleagues (2014) evaluated the efficacy of a brief, 10-minute loving-kindness meditation intervention. The study demonstrated that a single 10-minute session significantly increased participants' positive emotions and their feelings of interpersonal connection toward strangers.

Review, daily practice and course outline0 figures

No citations in this section of the module text.